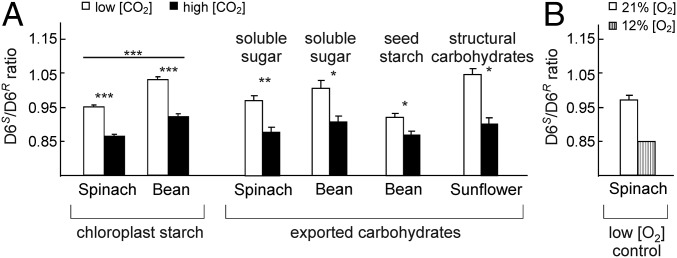
Fig. 3.
Response of the D6S/D6R ratio of different species and metabolites to manipulation of the [CO2]/[O2] ratio. (A) [CO2] manipulation; white bars represent low and black bars represent high [CO2] of 360 ppm and 700 ppm, respectively, except for sunflower (200 ppm and 1,000 ppm). (B) O2 manipulation; white bar represents ambient atmosphere, and gray bar represents ambient [CO2] with reduced [O2] (12%); glucose from soluble sugars was analyzed. Values are averages ± SEM (n = 2–5), except for one single sample pooled from several plants. *P < 0.05; **P < 0.01; ***P < 0.001 (ANOVA).

