Fig. S2.
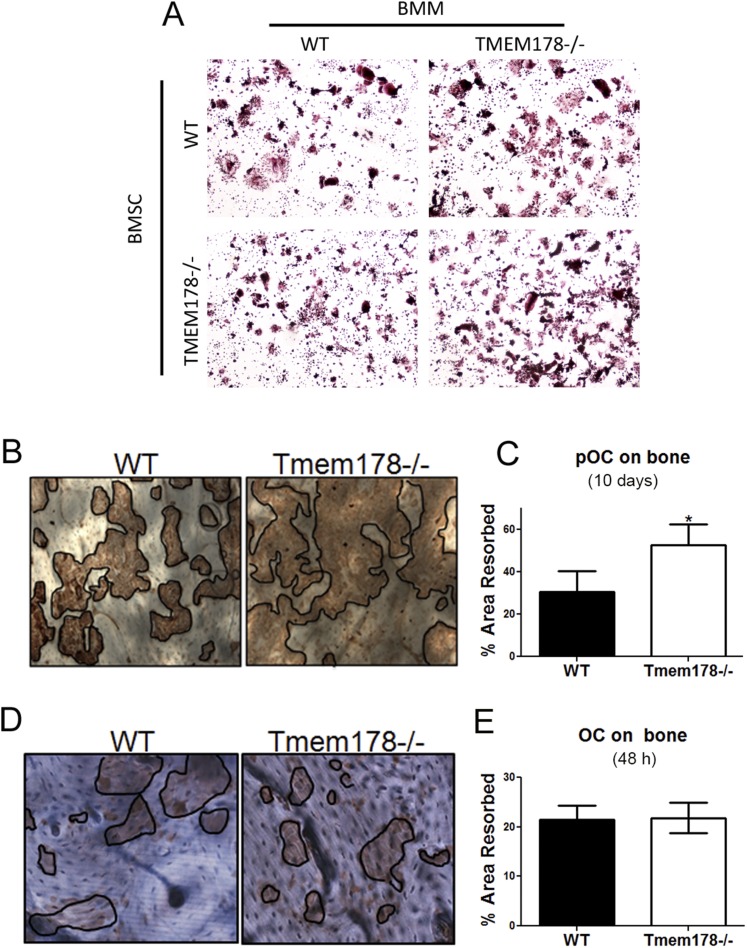
(A) Representative bright field images of TRAP-stained OCs grown by coculture of WT and Tmem178−/− BMMs and BMSC as indicated. (B) Representative bright field images of resorptive pits in WT and Tmem178−/− BMMs cultured on bovine bone slices in the presence of 10 ng/mL M-CSF and 50 ng/mL RANKL for 10 d. Resorption pits were visualized by staining with peroxidase-conjugated wheat-germ agglutinin. Black lines delineate the resorbed areas. n = 8–9 per genotype. (C) Quantification of resorbed area in images from B. *P < 0.05. (D) Representative bright field images of resorptive pits in WT and Tmem178−/− pre-OCs lifted and replated on bovine bone slices in the presence of 10 ng/mL M-CSF and 50 ng/mL RANKL for 48 h. n = 8–9 per genotype. (E) Quantification of resorbed area in images from D. n = 8–9 per genotype.

