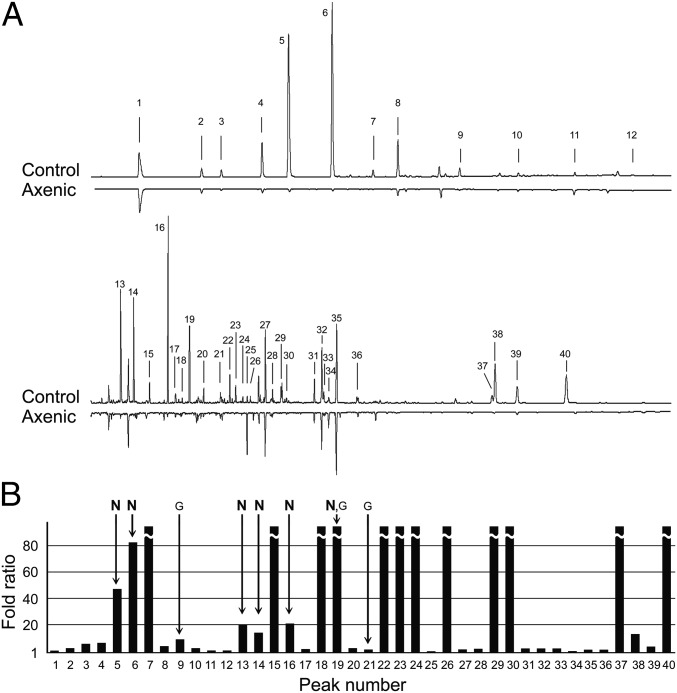
Fig. 3.
Carboxylic acids extracted from control nonsterile and axenic feces. (A) Gas chromatograms of the control and axenic extracts. Chemical names and percentage composition of each total extract are listed in Table S2. The control group had 65 μg of VCAs per 100 mg of feces, which was fourfold the VCA content of the axenic group. (B) Fold ratio (FR) is the peak area of each compound in the control group divided by its peak area in the axenic group. FR = 1 indicates no effect of the treatment whereas FR > 1 indicates that the axenic condition decreased a particular compound relative to the control extract. Arrows indicate the compounds that were included in the synthetic VCA mixtures for Fig. 4. G, Mix-G (32); N, Mix-NCSU. Three compounds from Mix-G were not detected in our chromatograms (Tables S2 and S3).

