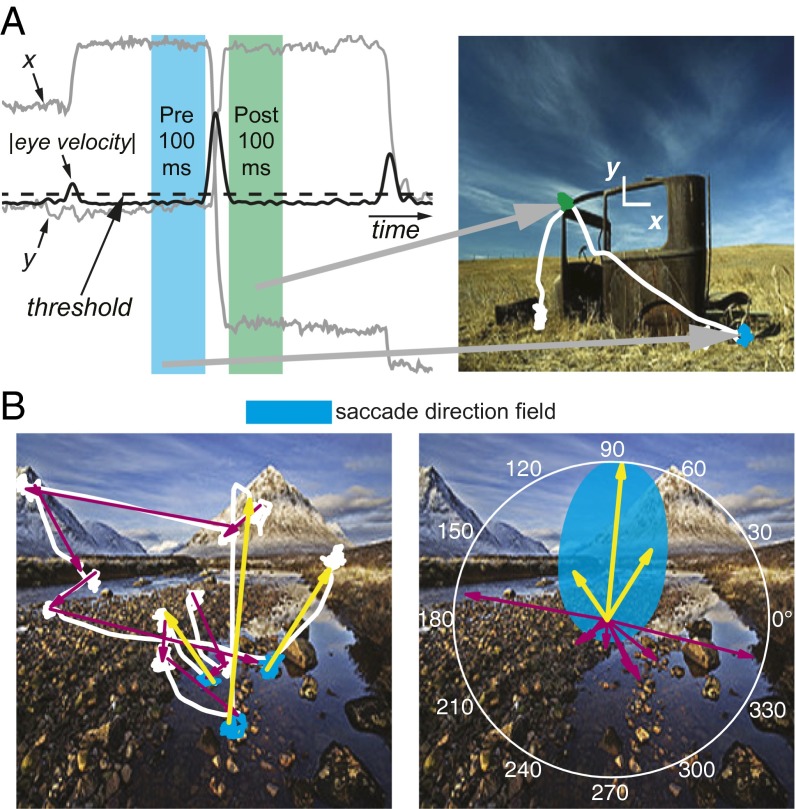
Fig. 1.
Overview of saccade direction analysis. (A) For each cell, the firing rate 100 ms before the magnitude of the eye velocity crossed the saccade detection threshold (25°/s, dashed line) and the firing rate 100 ms after the eye velocity magnitude went below threshold were compared with the angle of saccades. This comparison was made using all saccades in each session with at least 100 ms of fixation before and after the saccade. (B) A hypothetical SD cell with the preferred saccade direction shown in cyan would have increased firing before the saccades depicted with yellow arrows but not before the saccades represented by magenta arrows. For direction analyses, saccades were treated as if they had started at the origin (Right). The white curves plotted on top of the photographs in A and B represent gaze location.

