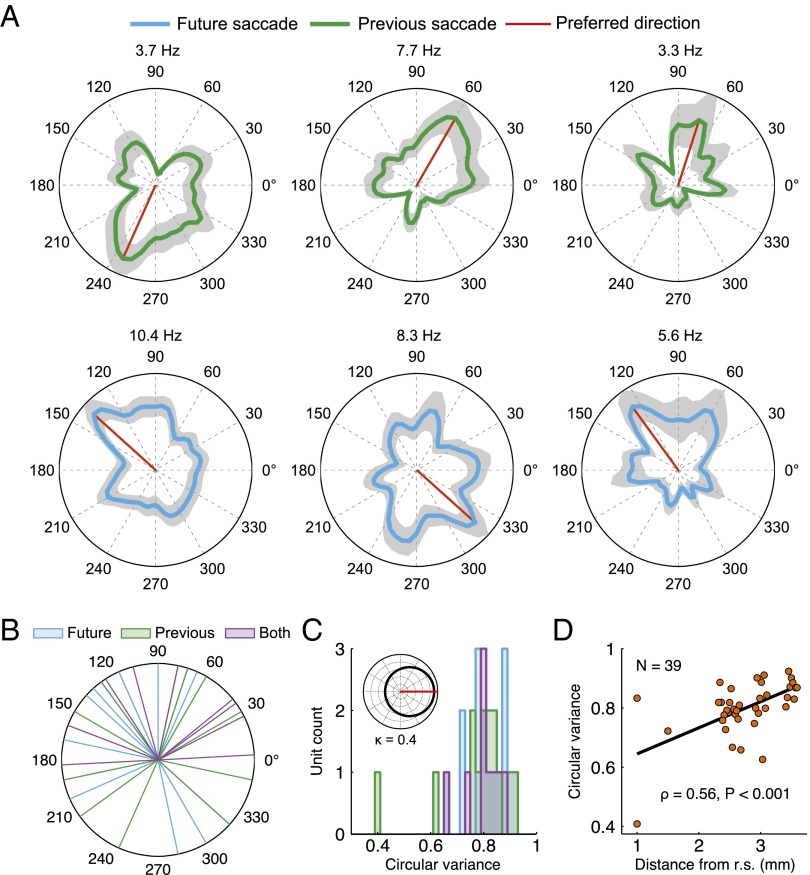
Fig. 2.
SD cell firing properties. (A) Angular probability densities representing perisaccade firing rates for six example cells with significantly nonuniform firing-rate distributions (Rayleigh test, P < 0.05). Plots in the upper row depict cells with significant previous saccade distributions, and plots in the lower row depict cells with a significant future saccade distribution. The maximum firing rate is listed at the top of each plot. The shaded regions represent the density ± 1 standard deviation. (B) Distribution of preferred directions (cyan: future saccade cells, n = 16; green: previous saccade cells, n = 14; purple: both future and previous, n = 9). (C) Histogram of the variance of tuning. The median variance was 0.81 across groups (similar to a von Mises distribution with κ = 0.4; Inset). (D) The width of tuning of individual neurons to a preferred saccade direction increased with distance from the rhinal sulcus (r.s.), as shown in the plot of circular variance for all SD cells. The black line is the best-fit line.

