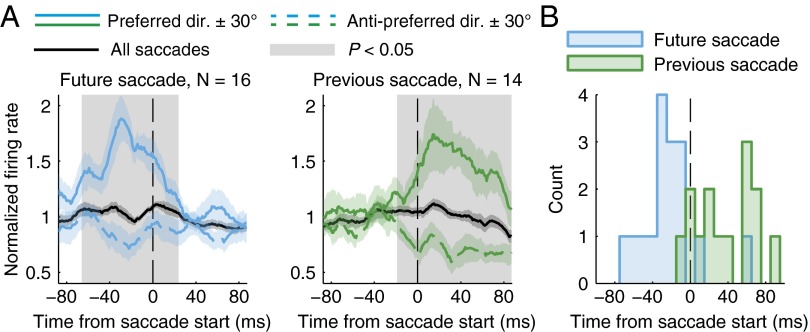
Fig. 3.
Time course of saccade direction encoding. (A) The firing rate normalized to the average rate over all saccades is shown for the 16 cells that encoded only future saccade direction and 14 cells that encoded only previous saccade direction. Rates are shown for all saccades (black), the preferred direction ± 30° (solid lines), and the anti-preferred direction ± 30° (dashed lines). Curves represent means ± SEM, and the gray shading represents a time region of significant difference between the preferred and anti-preferred directions (P < 0.05). (B) Histogram of peak firing latencies (10-ms bin width). The median latency was −27 ms for future saccade cells and +38 ms for previous saccade cells (same groups as in A).

