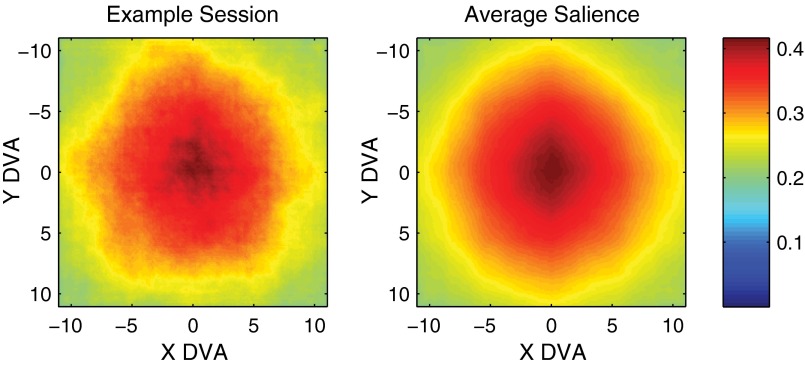
Fig. S1.
Distribution of salience. Salience (ranging from 0 to 1) was computed for each image and averaged across images (52). The left plot shows the salience averaged across images in one session, and the plot on the right shows the salience averaged across all images in all sessions. Salience tended to be greater near the center of images but typically had no direction bias.

