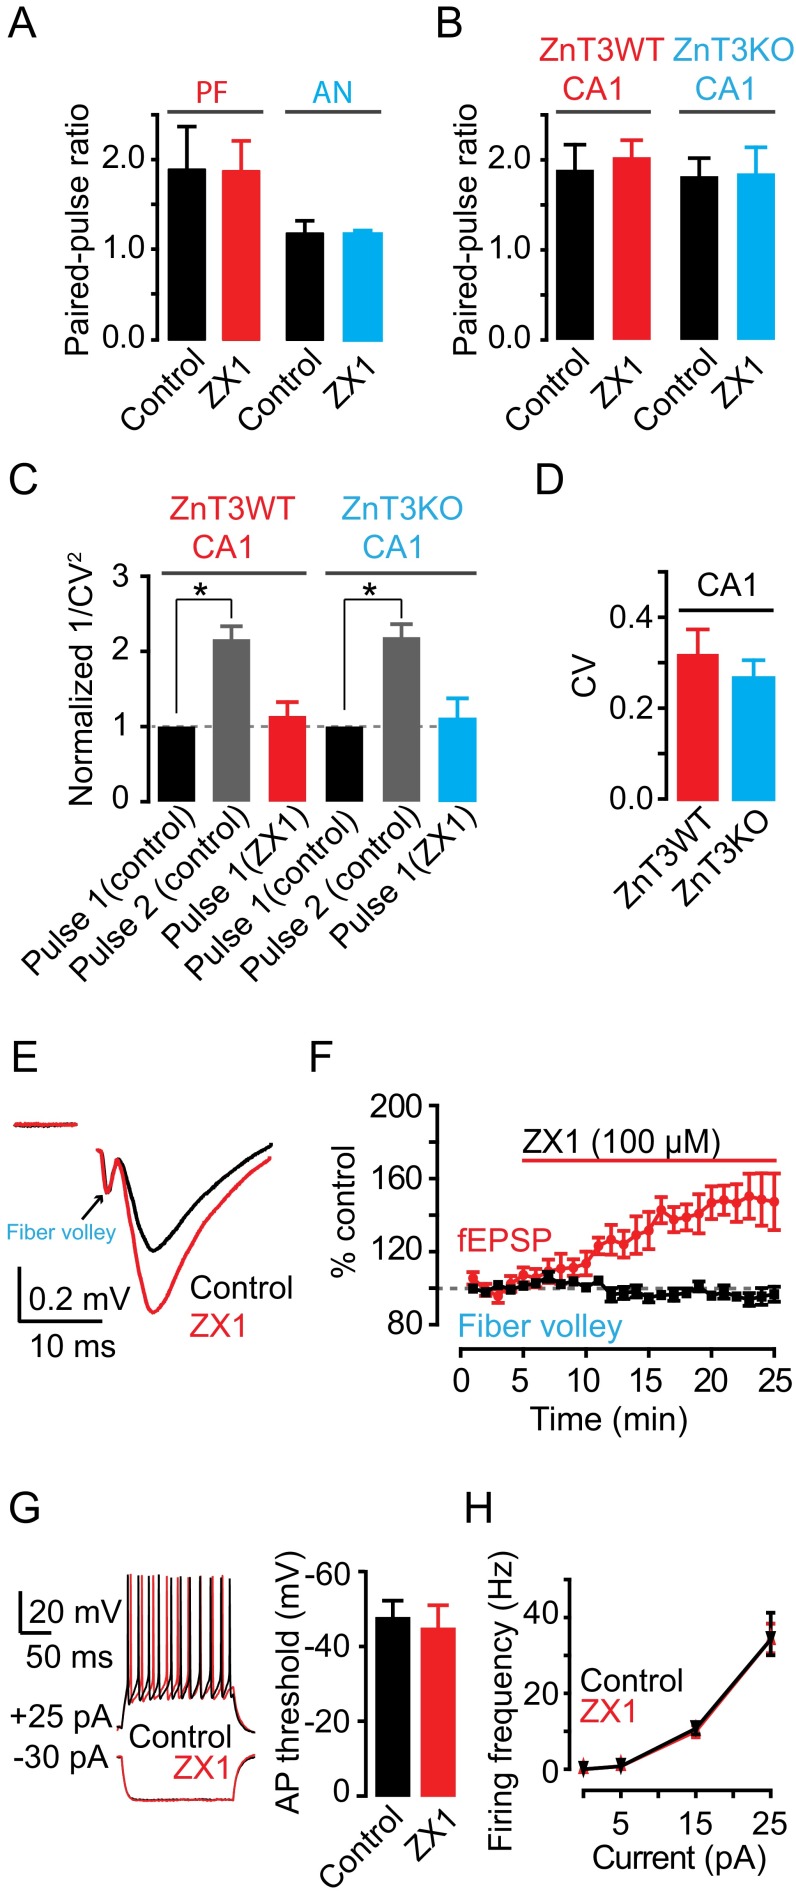
Fig. S3.
(A) Summary graph of PPR of fusiform cell PF and AN EPSCs from two-pathway experiments. (PF EPSCs: control: 1.88 ± 0.475; ZX1: 1.85 ± 0.334, P = 0.97, n = 3; AN EPSCs: control: 1.18 ± 0.13; ZX1: 1.17 ± 0.03, P = 0.94, n = 3, Student paired t test.) (B–D) Summary graph of PPR (B), normalized 1/CV2 (C), and CV (D) of SC EPSCS from CA1 hippocampal neurons form ZnT3WT and ZnT3KO mice (PPR: ZnT3WT: control: 1.89 ± 0.28; ZX1: 2.03 ± 0.19, P = 0.18, n = 5; ZnT3KO: control: 1.82 ± 0.20; ZX1: 1.85 ± 0.29, P = 0.35, n = 5, Student paired t test; Control PPR: ZnT3WT vs. ZnT3KO; P = 0.84, n = 5, Student unpaired t test; 1/CV2 normalized and compared with control first pulse: ZnT3WT: control second pulse: 2.19 ± 0.17, P < 0.01, n = 5; ZX1 first pulse: 1.11 ± 0.26, P = 0.97, n = 5; ZnT3KO: control second pulse: 2.16 ± 0.17, P < 0.01, n = 5; ZX1 first pulse: 1.14 ± 0.18, P = 0.79, n = 5, one-way ANOVA, post hoc Tukey; CV of pulse 1: ZnT3WT: 0.32 ± 0.08; ZnT3KO: 0.27 ± 0.07; P = 0.65, Student unpaired t test). (E) Representative hippocampal fEPSPs recorded in stratum radiatum before and after ZX1 application. (F) Time course of initial slope of fEPSPs and fiber volley amplitude before and after ZX1 application (initial slope of fEPSPs: 20–25 min after ZX1 application: 148.24 ± 3.47% of baseline, n = 5, P < 0.01, Student paired t test; fiber volley amplitude: 20–25 min after ZX1 application: -4.09 ± 1.52% of baseline, Student paired t test, n = 5, P = 0.10). (G, Left) Representative traces showing granule cell response to current injections before and after ZX1 application. (Right) Summary graph of granule cell action potential threshold before and after ZX1 application (control: 48.46 ± 4.41 vs. ZX1: 45.71 ± 4.94, n = 4, P = 0.68, Wilcoxon rank sum test). (H) Summary graph of granule cell firing frequency as a function of injected current amplitude (F-I curve) before and after ZX1 application (5 pA: control: 0.83 ± 0.83, ZX1: 0.83 ± 0.83, n = 4, P = 0.84; 15 pA: control: 10.04 ± 1.60, ZX1: 10.78 ± 1.58, n = 4, P = 0.88; 25 pA: control: 34.23 ± 4.17, ZX1: 35.94 ± 5.31, n = 4, P = 0.68, Wilcoxon rank sum test). Values represent mean ± SEM.

