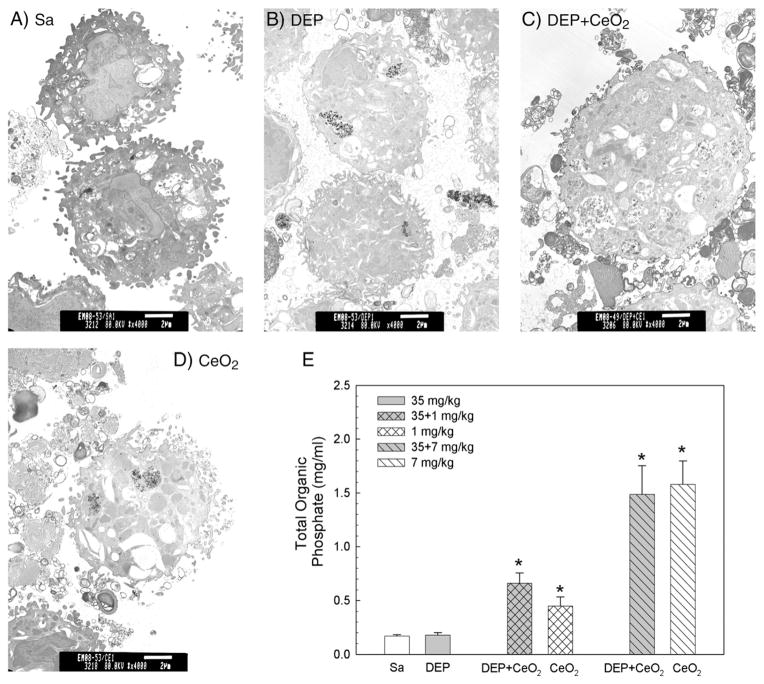
Fig. 6.
Effect of DEP with or without CeO2 exposure on phospholipid content in the 1st BALF and micrographs of TEM analysis of AM. (A) TEM of AM isolated by bronchoalveolar lavage from (A) control, (B) DEP (35 mg/kg)-, (C) DEP with CeO2 (3.5 mg/kg)- and (D) CeO2-exposed rats at 10 days post-exposure (bar = 2 μm). (E) The phospholipid content in the first BALF obtained from saline and various concentrations of CeO2-exposed rats at 28 days post-exposure. The values are expressed as means ± SE, n = 6. *Significantly different from saline control group at p < 0.05.

