Fig. 8.
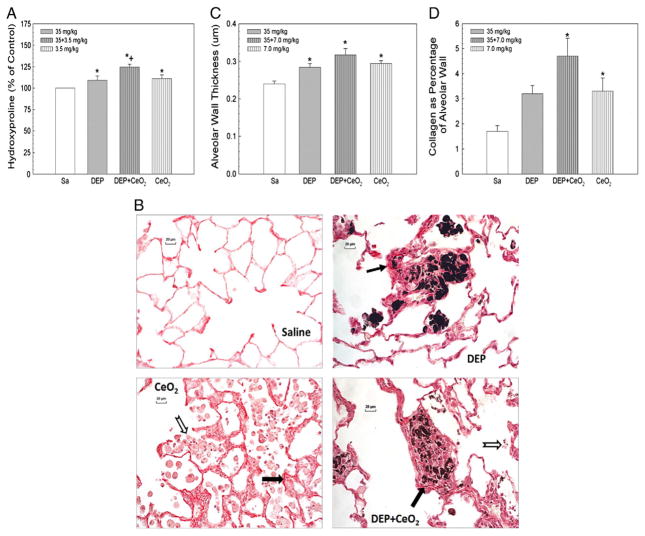
Effects of DEP-, CeO2- and DEP + CeO2-exposure on hydroxyproline content and Sirius Red staining for collagen in the lung tissue and quantitative morphometric analysis of alveolar wall thickness and alveolar collagen fiber volume in rat lung tissues. (A) Hydroxyproline content in the lung tissue. The values are expressed as means ± SE, n = 6. (B) Light micrograph of Sirius Red staining for collagen formation in the lung tissues (arrow) at 28 days post-exposure (cerium dose: 7 mg/kg). Acellular surfactant clumps (open arrow) were detected in the airspace of the CeO2 (7 mg/kg)- and DEP (35 mg/kg) + CeO2-exposed lungs. (C) Quantitative analysis of dose-dependent increase in the thickness of alveolar wall connective tissue. (D) Quantitative analysis of alveolar collagen volume expressed as a percentage of total tissue volume, based on the morphometric analysis of Sirius Red stained sections. *Significantly different from saline controls; p < 0.05. +Significantly different from CeO2 alone or DEP alone groups, at p < 0.05.

