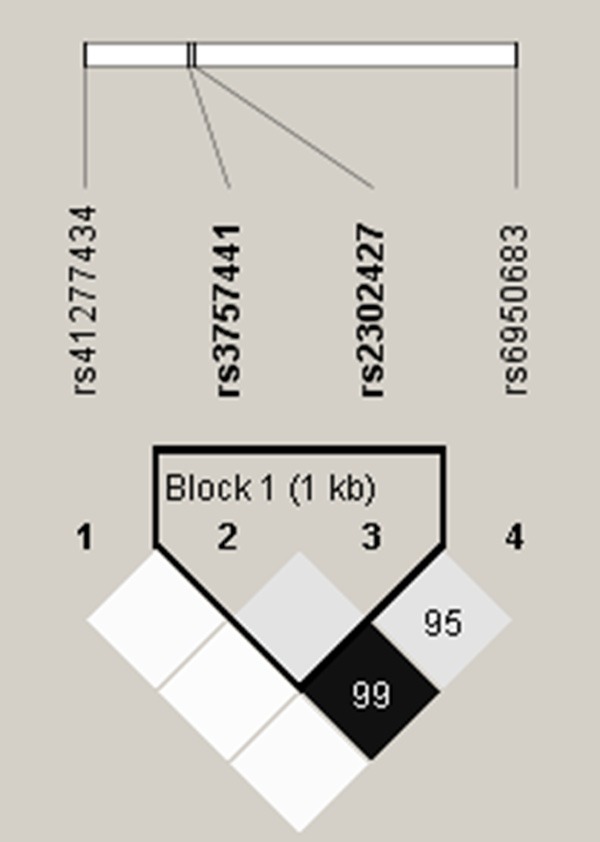
Figure 1.

EZH2 pairwise linkage disequilibrium (LD) patterns. Schematic presentation of the EZH2, indicating the locations of the SNP polymorphism and the pairwise linkage disequilibrium measures D’. The measure of D’ of SNP is shown graphically according to a grey scale, where white represents low D’ and dark represents high D’.
