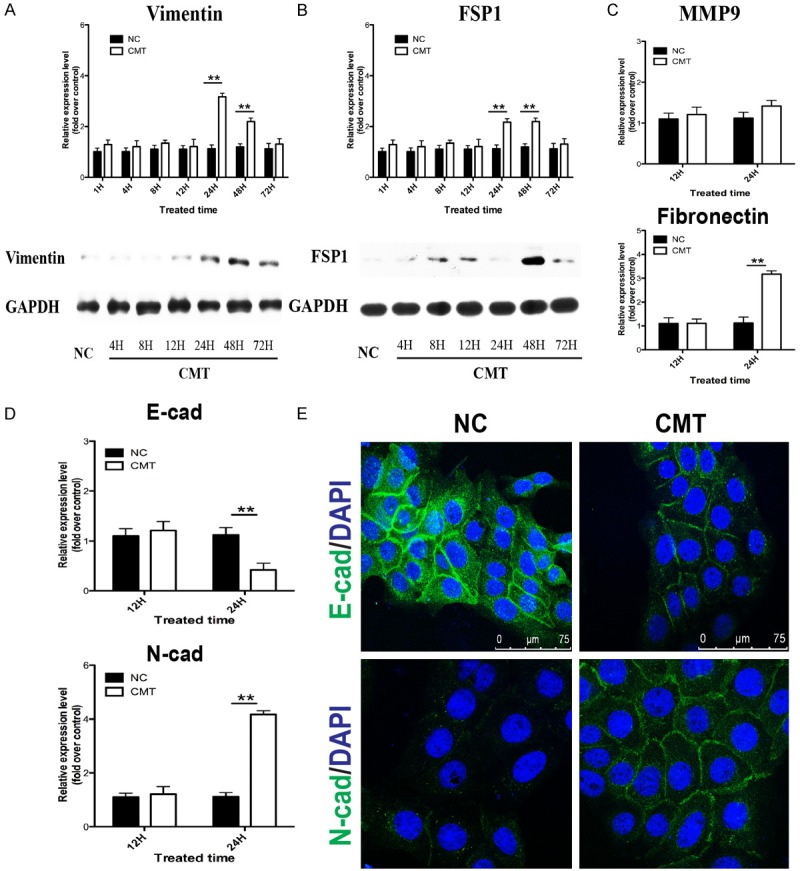
Figure 2.

EMT features were induced in keratinocytes by BioF. (A-C) The relative expression of EMT markers vimentin and FSP1, MMP9 over control were measured by real-time PCR and western blot at 1, 4, 8, 12, 24, 48, and 72 h after CMT was applied. The relative expression of cell-cell adhesion markers E-cadherin, N-cadherin (D) were measured by real-time PCR at 12 and 24 h after CMT was applied. GAPDH expression was used as an internal control. (E) The location and expression of E-cadherin and N-cadherin, labeled by Alexa Fluor® 488 conjugated antibody, were visualized by immunofluorescence experiments. Nucleus (blue) was stained with DAPI. NC: negative control. Data were presented as the mean ± SD, n ≥ 3; *p < 0.05, **p < 0.01
