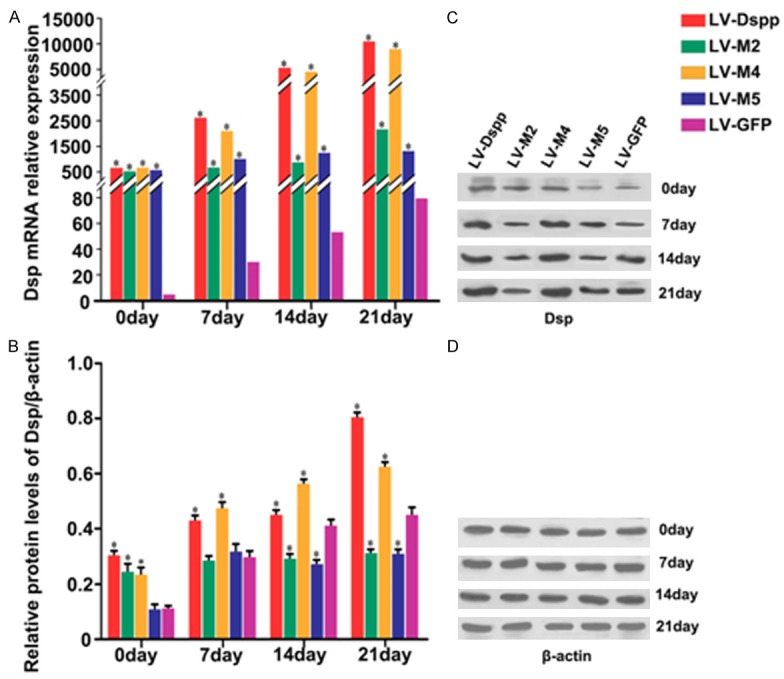
Figure 6.

Expression of Dsp in each group during the differentiation of transfected OLCs. A. mRNA expression of Dsp was investigated by Real-time PCR analysis. B, C. Protein expression of Dsp was detected by Western-Blot. D. β-actin served as an internal control. *Indicates statistical difference between the test group and the control P < 0.05. It is worth mentioning that the levels of Dsp were thousands times higher in the test groups than in the control, resulting in the large margin of error bars, so the error bars in the graph were not indicated.
