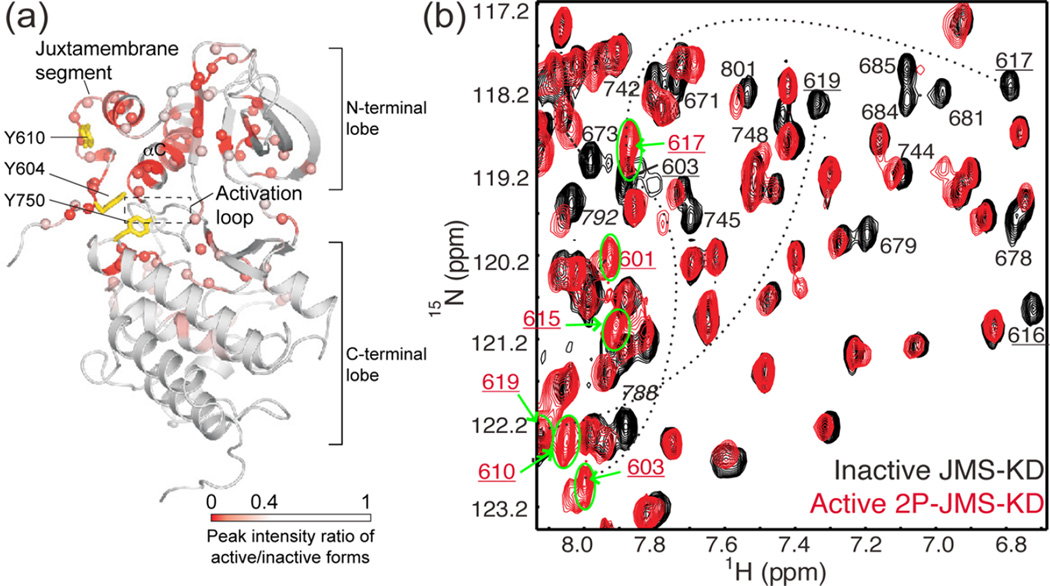
Figure 2.
Activation of Eph alters conformational dynamics in the kinase domain and juxtamembrane segment (JMS). (a) X-ray structure of the autoinhibited JMS-KD of EphB2 (PDB 1JPA14), mapping residues with spectral perturbations (red/pink) accompanying activation by phosphorylation. NMR line broadening and chemical shift perturbations reflect conformational and dynamic changes from the JMS contact site propagating to the active site cleft. Sites for activating tyrosine phosphorylation (Y604, Y610 for murine EphB2) and an activating mutation (Y750) are represented with yellow sticks. (b) 15N-HSQC spectra overlaying autoinhibited JMS-KD (black) and activated EphB2 2P-JMS-KD (red), where resonances showing significant spectral perturbations are labeled. In 2P-JMS-KD, peaks corresponding to JMS residues (numbers underlined) shifted to ~8 ppm (green circle and bold arrows), revealing an order-to-disorder transition in this region upon activation. Adapted with permission from ref 14. Copyright 2006 EMBO Press.

