Abstract
In photosynthesis, photosystem II (PSII) is the multi-subunit membrane protein complex that catalyzes photo-oxidation of water into dioxygen through the oxygen evolving complex (OEC). To understand the water oxidation reaction, it is important to get structural information about the transient and intermediate states of the OEC in the dimeric PSII core complex (dPSIIcc). In recent times, femtosecond X-ray pulses from the free electron laser (XFEL) are being used to obtain X-ray diffraction (XRD) data of dPSIIcc microcrystals at room temperature that are free of radiation damage. In our experiments at the XFEL, we used an electrospun liquid microjet setup that requires microcrystals less than 40 μm in size. In this study, we explored various microseeding techniques to get a high yield of monodisperse uniform-sized microcrystals. Monodisperse microcrystals of dPSIIcc of uniform size were a key to improve the stability of the jet and the quality of XRD data obtained at the XFEL. This was evident by an improvement of the quality of the datasets obtained, from 6.5 Å, using crystals grown without the micro seeding approach, to 4.5 Å using crystals generated with the new method.
I. INTRODUCTION
Knowing the crystal structure of a protein is key to understand its biological function. Many biological processes (e.g., photosynthesis, respiration, and molecular transport) depend on membrane proteins. The prediction of membrane protein topology in many organisms shows that between 20% and 30% of the proteome represents membrane proteins1 and about 40% of the drug targets are membrane proteins.2 Despite the importance of this protein type, there are less than 1900 membrane protein structures available in the protein data bank (PDB) compared to more than 106 000 protein structures in total. This is largely due to difficulties in the purification and crystallization process that arise from the hydrophobic nature of membrane proteins.3 Even after successful purification and crystallization, growing large crystals from a membrane protein is an additional challenge. Large crystals are advantageous in conventional synchrotron X-ray crystallography, as the average diffraction intensity that can be observed from a crystal of volume Vcrystal and unit cell volume Vcell using an X-ray beam of intensity I is approximately proportional to I(Vcrystal/Vcell).4
X-ray free electron lasers (XFELs) have opened the horizon for a new era of crystallography, by offering very short X-ray pulses (<50 fs), micro-focused beams with high brilliance and coherence.5 These features enable diffraction data collection at room temperature (RT) before the manifestation of radiation damage and provide new approaches for time resolved studies6,7 by the use of microcrystals. Potentially smaller crystals have lower long-range disorder,4 thus increasing the chances of getting high resolution diffraction data.
One of the important photosynthetic membrane protein is the dimeric photosystem II core complex (dPSIIcc), a multi-subunit membrane protein complex that catalyzes light-activated water oxidation in the oxygen-evolving complex (OEC).8 During the catalytic cycle, the OEC, a cluster of μ-oxo-bridged manganese and calcium ions (Mn4O5Ca), oxidizes water via five intermediate charge-storage or S-states, S0–S4.9,10 To unravel the mechanism of this intricate reaction, it is imperative to obtain information about structural details of each of the intermediate states as well as the transient states. In synchrotrons, the dark-stable S1 state has so far been studied by crystallography at cryogenic temperature. But it is known that the X-ray doses used lead to radiation-induced damage in the Mn4O5Ca cluster even at low temperature.11,12 To avoid this effect and collect undamaged crystal structures for all the S-states, it has been demonstrated that the use of XFEL is key and one can collect data free of radiation damage even at RT.6,13–16 Our group has demonstrated the applicability of this approach to dPSIIcc at LCLS (Linac Coherent Light Source, SLAC, USA) using an electrospun liquid microjet.6,13,14 With our system, we have been able to probe different intermediate states of the catalytic cycle in dPSIIcc.6 Recently, Suga et al. reported a radiation damage free structure of the S1-state of dPSIIcc at a resolution of 1.95 Å at cryogenic temperature by collecting still diffraction images from several 100 μm large crystals at SACLA, Japan.16 In addition, Kupitz et al. reported collection of RT diffraction data from dPSIIcc at 5–5.5 Å resolution using small microcrystals in a gas focusing liquid jet system.15
There are several challenges, however, to collect crystallography data at an XFEL at RT by Serial Femtosecond X-ray crystallography (SFX). One of them is the stable sample delivery. The experimental setup of SFX requires a delivery system for the microcrystals to the X-ray beam. The delivery rate should be slow enough to minimize the volume of unused sample between the LCLS X-ray pulses (120 Hz). A homogenous microcrystal suspension is required for a good hit rate and stable sample delivery. In addition, a homogenous distribution of crystal sizes (i.e., monodispersity) is ideal to ensure uniform pump laser illumination conditions for crystals that are used to record diffraction from different photoinduced states. This was also shown in a recent study by Tenboer et al., where the authors performed time-resolved laser-pump X-ray probe SFX experiments on microcrystals of the photoactive yellow protein.7 From prior synchrotron experiments, the authors observed that for larger crystals, the pump laser beam used did not penetrate the crystal uniformly. Further, the laser pulses had damaging effects on the crystals, limiting the total number of laser pulses that a crystal can tolerate. These problems were overcome by using microcrystals. The microcrystals could be uniformly illuminated, as their average size was smaller than that of laser beam penetration length. In addition, in the SFX experiments, each microcrystal was illuminated only once, so that a higher laser pulsed energy could be used for achieving a higher yield of excited state formation without photo bleaching.7
In this study, microseeding is introduced as a suitable tool to improve microcrystallization of dPSIIcc. Seeding techniques have been used over many years to enhance crystallization of macromolecules. Generally, seeding techniques can be divided into macroseeding and microseeding.17 In macroseeding, a reasonably large crystal is washed and transferred to an equilibrated crystallization drop to continue the crystal growth. In microseeding, a crystal suspension is prepared from microcrystals and after serial dilutions a small volume of the seed stock is added to a pre-equilibrated crystallization drop.18 Our motivation for exploring seeding techniques was to produce microcrystals exhibiting a monodisperse, uniform size distribution in contrast to those obtained from earlier microcrystallization experiments13,14 without seeding, thereby making them better suited for our XFEL studies. In general, a uniform size distribution of microcrystals is a necessity for time-resolved SFX studies that depend upon uniform triggering of the reaction studied, either by use of photoactivation or by mixing. In case of phototriggering, the uniform microcrystals provide for uniform illumination of the sample. Whereas in the case of chemical mixing, uniformly sized microcrystals could provide for an adequately short diffusion time for a certain substrate to induce a uniform structural change through the whole microcrystal.19 The method of producing a high yield of monodisperse uniform microcrystals presented here will be particularly useful for such experiments. Furthermore, uniform microcrystals could reduce shot-to-shot variation in the strength of the recorded signal. This may impact the accuracy of intensity measurements, thereby enabling various types of experimental phasing for measurements where anomalous differences are important.
II. MATERIALS AND METHODS
A. Cell growth and protein purification
An automated photobioreactor (PBR) 10/20 was used to grow cells of the thermophilic cyanobacterium Thermosynechococcus elongatus BP-1. dPSIIcc was extracted and purified as described previously20 using n-dodecyl-β-D-maltoside (βDM) as detergent and column chromatography with a weak anion exchanger (Toyo DEAE).
B. Determination of the metastable zone
The metastable zone of the phase diagram of dPSIIcc was studied at three different protein concentrations of 3.7, 7.6, and 20 mg/ml (corresponding to 0.37, 0.76, and 2 mM Chla) to avoid large sample consumption. The three different protein concentrations were screened using 2.2%–6% (w/v) of polyethylene glycol (PEG) 2000 as precipitant with 0.1% steps in buffer A containing 100 mM 1,4-Piperazinediethanesulfonic acid (PIPES) (pH 7.0) and 5 mM CaCl2. The final βDM concentration was kept constant (0.015% (w/v)) in all crystallization setups. Microseeding was used to differentiate between the unsaturated, metastable, and labile zones by using three different seed concentrations, 1:10, 1:100, and 1:1000. The three different concentrations were used to study the effect of seed concentration on the crystal number and crystal size. Microbatch crystallization was performed in 96 well impact plates without reservoir (Hampton Research, CA, USA) to establish the different zones of the phase diagram for dPSIIcc at these particular concentrations. In each well, a 5 μl protein/precipitant mixture was added and the plate was sealed with crystal clear sealing tape (Hampton Research, CA, USA). The sealed plates were left in the dark at RT for 4 days. The plates were observed every day under a standard optical microscope using dim green light.
C. Preparation of the seed stock
The dPSIIcc crystals (with 200–300 μm along the longer axis) were prepared as described in Ref. 20. Five dPSIIcc crystals were transferred to 50 μl of 6% PEG 2000 in buffer A. A seed tool kit (Hampton research) was used to crush these crystals by vortexing for 3 min. The mixture was centrifuged at 13 000 rpm for 1 min and 10 μl from the supernatant was mixed with 90 μl of mother liquor, ML (6% PEG 2000 in buffer A and 0.03% βDM), to prepare the 1:10 seed stock, which was used for further serial dilutions to prepare the 1:100 and 1:1000 seed stocks. 0.5 μl of the seed stock was added to 40 μl crystallization setup. The PEG 2000 concentration in the ML was considered in the final concentration of every crystallization setup. These stock solutions were used in the different seeding protocols as described in Sec. III.
D. Dynamic Light Scattering (DLS)
DLS (Zetasizer Nano ZS with 525 nm laser) was used to measure the distribution of the hydrodynamic radii (RH) for dPSIIcc microcrystals. Each measurement was started 10 min after mixing the crystallization setup, lasted 16 s, and was repeated 16 times. Subsequently, the dPSIIcc microcrystals were observed under a light microscope (Carl Zeiss, SteREO Discovery V20) to monitor the sizes of microcrystals that were beyond the DLS measuring range.
E. Sample injection and illumination
Samples were injected into the Coherent X-Ray Imaging (CXI) instrument chamber using an electrospun liquid microjet.21 Aliquots of 50–150 μl of sample were placed in a microcentrifuge tube placed inside the pressurized cell with a Pt-electrode and the end of the injector capillary submerged in the sample. Pressures of 17–20 psi against the CXI chamber pressure (10−4 Torr) and voltages of around 3000 V were applied depending on the buffer composition and crystal concentration. A clear silica capillary with an inner diameter (ID) of 75 or 100 μm and an outer diameter (OD) of 150 or 360 μm, respectively, was used for the injector capillary. The flow rate was in the range of 0.25–1.0 μl/min (for the 75 μm ID capillary) and 1.2–3.5 μl/min (for the 100 μm ID capillary) depending on the sample viscosity and the backing pressure. To ensure that the samples were in the dark-stable S1-state before injection, all sample handling and storage were performed in darkness or under dim green light. For visualization of the jet, an infrared laser diode (Coherent Lasiris, 785 nm, 15 mW) was used.21 The wavelength was chosen to be outside the absorption spectrum of PSIIcc.
F. CXI instrument and parameters
The CXI instrument of LCLS22 was used in the 1 μm focus setting with the beam being focused to 1.5 × 1.5 μm2 full width half maximum using Kirkpatrick-Baez mirrors.23 The pulse length used was about 45 fs and the repetition rate was 120 Hz. The X-ray diffraction (XRD) data were collected at two energies, 7.1 and ∼9.5 keV, with 3–6 × 10¹¹ photons/pulse. The dose therefore varied between 50 and 300 MGray. XRD data were collected using a Cornell-SLAC Pixel Array Detector (CSPAD).24
III. RESULTS
A. Microcrystallization of dPSIIcc
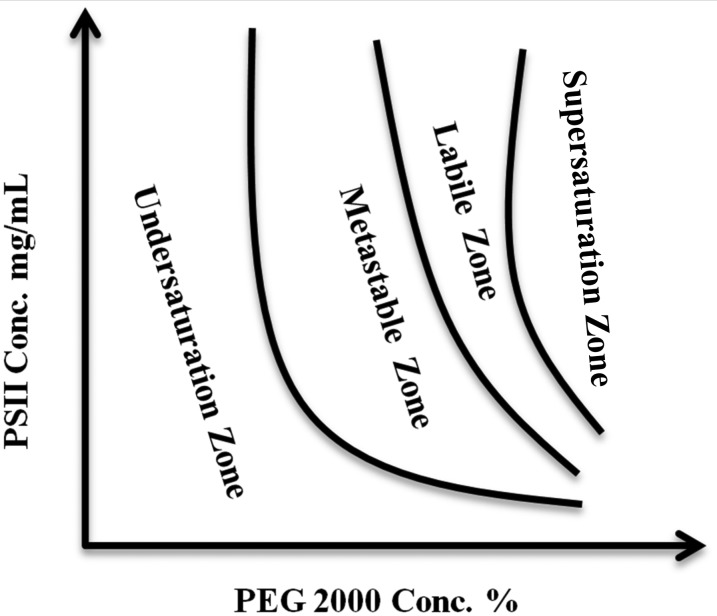
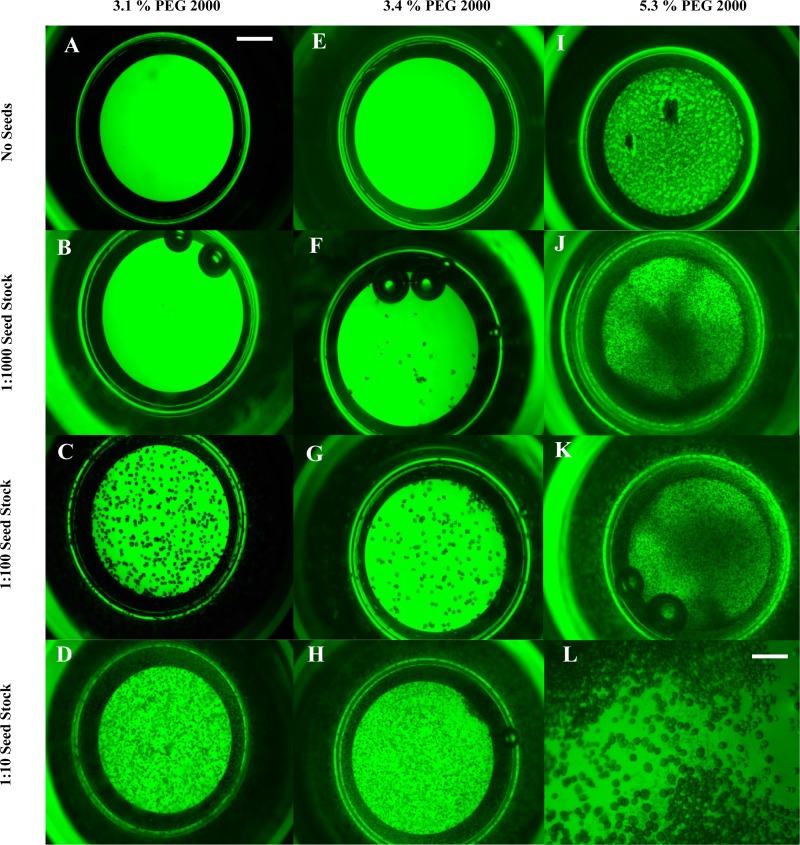
The area of the phase diagram where nucleation of crystals is induced is generally located next to the aggregation zone (“supersaturation zone”) and is termed “labile zone.” In the case of dPSIIcc and PEG 2000, the labile zone is narrow at low protein concentrations (see Fig. 1), where microcrystallization occurs. This zone is generally preferred for performing crystallization as this allows efficient usage of the protein.17 But in the case of dPSIIcc, the narrow labile zone increases the chance of formation of aggregates at the expense of crystal nucleation as shown below in Figs. 2(I)–(L). The metastable zone, at 7.6 mg/ml (0.76 mM Chla) dPSIIcc concentration, is in the region between 3% and 5% of PEG 2000 and the labile zone between 5.0% and 5.5%. The edge of this region varies from preparation to preparation. However, microcrystallization with seeding at 4.8% PEG 2000 consistently gave microcrystals with every dPSIIcc preparation. After establishing the border between the labile and metastable zones, we investigated the use of three techniques for producing microcrystals from our dPSIIcc preparation.
FIG. 1.
A schematic diagram for the phase diagram of dPSIIcc protein against PEG 2000 as precipitant. The diagram was established based on the three different dPSIIcc protein concentrations used for the crystallization experiments and a wide concentration range of PEG 2000 as described in Sec. II.
FIG. 2.
Three crystallization setups showing the effect of seed concentration on crystal size and crystal number. The dPSIIcc protein concentration was 7.6 mg/ml (0.76 mM Chla) in all. A, B, C, and D—the PEG 2000 concentration was 3.1%. E, F, G, and H—the PEG concentration was 3.4%. I, J, K, and L—the PEG 2000 concentration was 5.3%. A, E, and I were made without adding any seeds. B, F, J seed stock 1:1000 was used, C, G, seed stock 1:100 was used, and D, H, L seed stock 1:10 was used. In J, precipitations start to appear, while in J and K, there are many microcrystals besides precipitations. L shows a closer look at K to show the microcrystals and the precipitations. The scale bar is 500 μm for A–H and 125 μm for L.
B. Microcrystals of dPSIIcc at XFEL
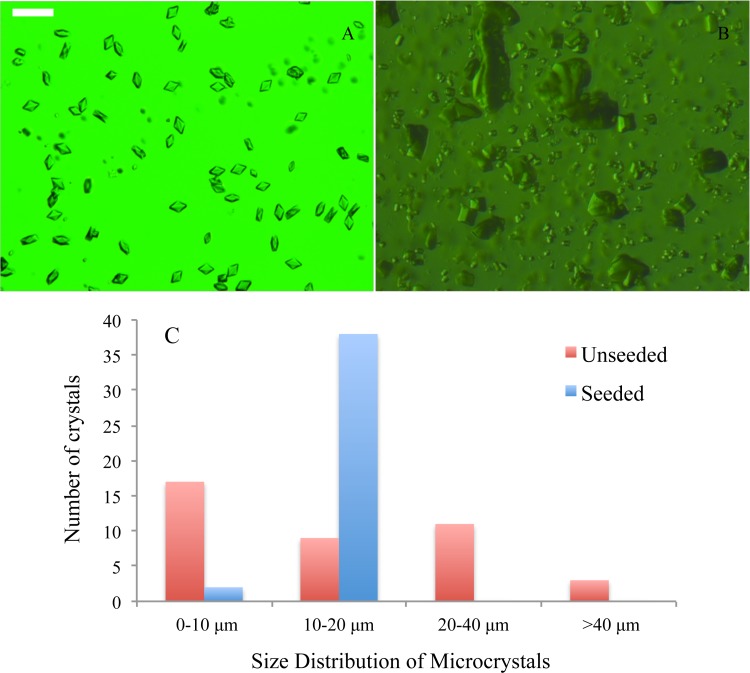
Initially, microcrystallization of dPSIIcc was performed at a higher concentration of PEG 2000 (∼5.5%), which resulted in occasional formation of aggregates. One critical disadvantage was the polydispersity of the dPSIIcc microcrystals that were obtained. Generally, the electrospun liquid microjet set up can only inject microcrystals of less than 30 μm length (or 40 μm for the 100 μm ID capillary) in the longest dimension. The high PEG 2000 concentration protocol of dPSIIcc microcrystallization results in a wide range of microcrystal sizes, some of them larger than 40 μm, see Fig. 3. In many cases, additional sedimentation or centrifugation steps were necessary to remove the larger crystals.13,14 The polydispersity of the microcrystal suspension also hampered the jet stability, thereby decreasing the hit rate. Another drawback of the high PEG microcrystallization protocol is the yield, as in this case only 5%–10% of the dPSIIcc starting material transformed to microcrystals.25 This type of microcrystals will be referred to as unseeded microcrystals.
FIG. 3.
Seeded vs unseeded microcrystals. (a) dPSIIcc microcrystals produced by double seeding protocol. (b) dPSIIcc microcrystal produced without seeding. (c) Histogram showing the size distribution of the microcrystals (red bars represent unseeded and blue bars seeded microcrystals). The scale bar is 30 μm.
In order to improve the yield and monodispersity of microcrystals, we tried three seeding microcrystallization protocols: (i) multiple seeding, (ii) in situ multiple seeding, and (iii) double seeding. The details of each method are described below.
1. Multiple seeding
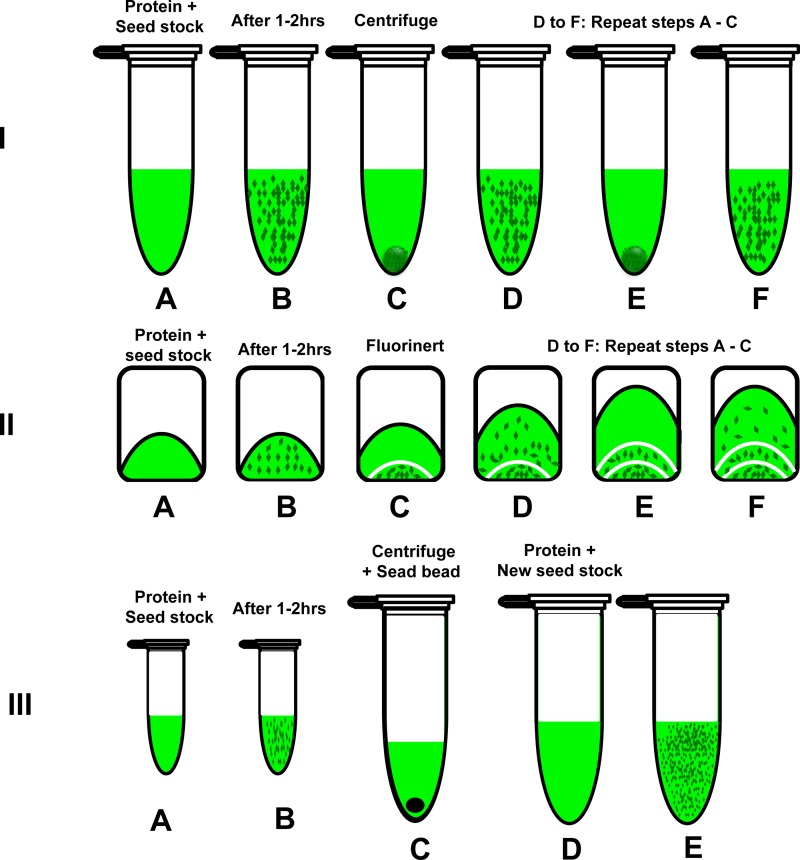
Crystallization was set up in polymerase chain reaction (PCR) tubes in a total volume of 40 μl. 32 μl of the 1:100 seed stock was mixed with 8 μl of dPSIIcc of 40 mg/ml (4 mM Chla). The crystallization setup was left for 1–2 h until the crystals reach ∼20 μm in length. The microcrystals were collected afterwards by centrifugation at 3000 rpm for 10 min (Fig. 4). The supernatant was collected and seeded again by adding 2 μl of the 1:10 seed stock (10% PEG 2000 in buffer A and 0.013% βDM was used to prepare the seed stock instead of 6% PEG 2000). In some cases, this elevation in the PEG 2000 concentration was not enough, so the PEG 2000 concentration was increased carefully by addition of 1 μl of 16% PEG 2000 in buffer A with 0.013% βDM. The setup was incubated at RT for 2 h until a second wave of dPSIIcc microcrystals grew. This process was repeated to grow a third wave of microcrystals.
FIG. 4.
A schematic representation of three different seeding protocols. I: Multiple seeding: A. Mixing the seed stock with protein. B. After 1–2 h. C. Centrifuging the crystal suspension at 3000 rpm for 10 min and collecting the supernatant to a new tube. D. After adding the 1:10 seed stock (that has 10% PEG 2000 in buffer A with 0.013% βDM). E and F are repeating C and D to get another wave of dPSIIcc microcrystals. II: In situ multiple seeding: A. The crystallization setup. B. After 1–2 h. C. After addition of Fluorinert to separate the microcrystals from the next wave. D. After addition of seeding stock and increasing the concentration of PEG 2000. E and F. Repeating the same procedure as C and D for the subsequent dPSIIcc microcrystals waves. III: Double seeding: A and B are the same as A and B for multiple seeding. C. The microcrystals from B were collected and crushed using seed bead kit from Hampton research. D. The crushed crystals were used to prepare a 500 μl seed stock. D. 408 μl of this seed stock was mixed with 96 μl of dPSIIcc protein solution of concentration 40 mg/ml (4 mM Chla).
2. In situ multiple seeding
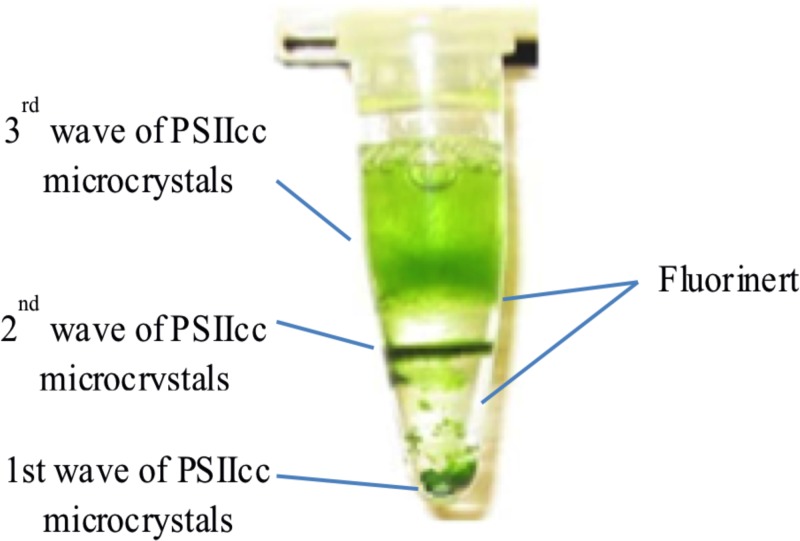
In this protocol, the centrifugation step in the multiple seeding protocol was replaced by phase separation using Fluorinert (Hampton Research, CA, USA). Once the microcrystals were grown to the desired size range, Fluorinert was added to the crystallization setup. The high density of Fluorinert (75% greater than water) resulted in the settling of the crystals in the crystallization tube, see Fig. 4 for illustration and Fig. 5. Once the crystals moved downwards to the high-density Fluorinert phase, growth stopped and crystals were stable. PEG 2000 was added to the remaining protein-containing supernatant, as described for the multiple seeding protocol. Increased precipitant concentration compensated for the reduced protein concentration, thereby inducing the formation of the next wave of microcrystals.
FIG. 5.
Photograph of an in-situ multiple seeding setup.
3. Double seeding
In this procedure, first the entire amount of microcrystals formed in a 40 μl crystallization setup (produced as in the initial step of the multiple seeding method by adding a seeding stock to the protein precipitant mixture) was used to produce a highly concentrated seed stock. For this purpose, a seed bead kit was used to crush the microcrystals, as described in Sec. II. This secondary seed stock was then mixed directly with the protein stock solution. For larger scale crystallization setups, such as used at LCLS in Ref. 6, 408 μl of this seed stock was mixed with 96 μl of dPSIIcc protein solution of concentration of 40 mg/ml (4 mM Chla) (Fig. 4).
The yield of microcrystals from each method was determined to compare the efficiency. After performing crystallization by following each of the three methods, the microcrystals were collected and dissolved in buffer A (with 0.03% βDM) to determine the amount of dPSIIcc protein that has transformed to microcrystals. To calculate the dPSIIcc protein in the microcrystals, the concentration of the protein obtained from the dissolved microcrystals, Cxtal, was determined as well as their volume Vxtal. The yield was calculated as follows:
| (1) |
Here, Vxtal is the volume of the microcrystals, Cxtal is the protein concentration in the dissolved microcrystals (the dilution of the microcrystals by the buffer was taken into account in the calculations), Vprotein is the volume of the protein used for crystallization, and Cprotein is the concentration of this protein. The protein concentration was determined by measuring the Chla concentration using the extinction coefficient of protein-bound Chla (1 mM Chla is about 10 mg/ml).26 To estimate Vxtal, after crystallization, the crystal suspension was centrifuged at 4000 rpm for 10 min and the supernatant was removed. A defined volume of buffer A (with 0.03% βDM) was added to dissolve the crystals.
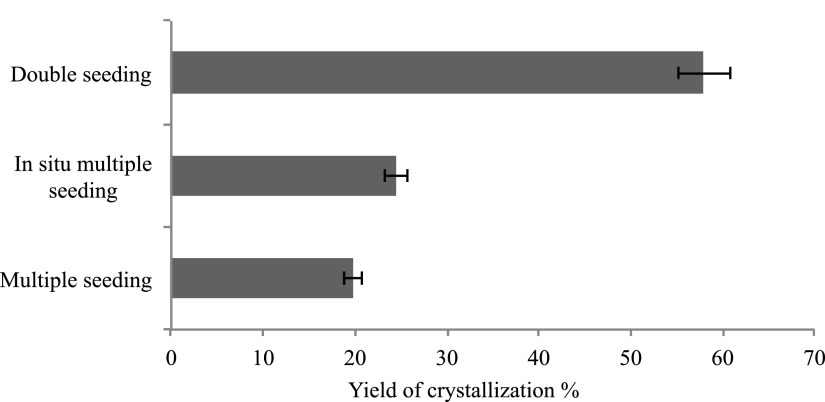
All three microcrystallization protocols improved the yield of dPSIIcc microcrystal to a great extent. In the case of double seeding, the yield reached about 60% (compared to the initial yield of ∼10% without seeding, as shown in Fig. 6). In addition, the size problem was largely avoided in the seeded microcrystallization protocols to a great extent (Figs. 2, 3, and 7). The monodispersity of the dPSIIcc microcrystals resulted in a stable jet with a uniform flow rate. It allowed achieving homogeneous flash illumination of samples also, resulting in higher overall turnover of the catalytic center. The multiple seeding protocol, however, did not prove to be a good candidate for high yield generation of high diffraction quality microcrystals of dPSIIcc. The water content of dPSIIcc crystals is about 60%,27,28 which makes them mechanically fragile, so the diffraction quality was negatively affected by centrifugation. The in situ multiple seeding protocol did circumvent the problem of mechanical damage due to centrifugation but it was challenging to remove the Fluorinert from the microcrystals leading to a reduction of the crystal yield as shown in Fig. 6. In contrast, the double seeding protocol did not employ centrifugation of the final microcrystals and recovery of the microcrystals by gravitational settling occurred in high yields. Therefore, this protocol was best suited for use in our XFEL SFX experiments at the LCLS.
FIG. 6.
Average crystallization yield obtained from different seeding techniques.
FIG. 7.
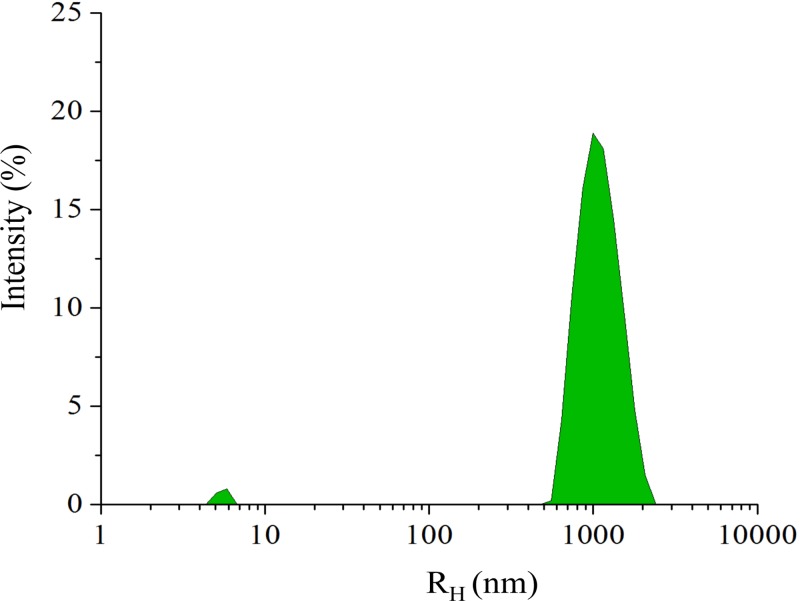
Size distribution from the DLS measurements for dPSIIcc microcrystals from the double seeding protocol that are measured 10 min after initiating crystallization by seeding. The small peak represents the dPSIIcc protein in solution that did not yet get incorporated in the crystals.
In order to characterize the size distribution of the obtained microcrystals, we used DLS measurements in the early stages of crystallization. Due to Brownian motion of the particles, the position in a suspension will change. The change in the particle position depends on the diffusion of each particle, which is inversely proportional to the hydrodynamic radius (RH) of the particle. DLS measures the change in the intensity of the scattered light from the suspension of macromolecules over time and DLS can be measured for microcrystals, too. The DLS results of the dPSIIcc microcrystals for the double seeding protocol showed a uniform size distribution. In the DLS data measured 10 min after mixing the protein with the seed stock, two peaks were detected, the dominant peak centered at RH = 1 μm and a small one at ∼7 nm. The dominant peak at 1 μm originated from the growing dPSIIcc microcrystals and showed a range of 0.6–2.5 μm (Fig. 7). The 7 nm peak is close to the theoretical and the measured RH values for dPSIIcc (6.23 and 7.8 nm, respectively).19,29,30 The microcrystallization set up was incubated and checked every 10 min under the microscope to monitor the size. Once the size reached 10–20 μm, 8% PEG 2000 in buffer A was added to stop the crystal growth. When comparing the size distribution of the seeded (double seeding protocol) and unseeded microcrystals, we observed a uniform size distribution in the seeded microcrystals (Fig. 3). Thus, establishing that the double seeding protocol produced monodisperse microcrystals.
By using the double seeding protocol, a high yield of monodisperse microcrystals was obtained. This lead to improvements of various aspects of the SFX experiments. First, it was possible to achieve a stable jet, leading to an increased number of crystal hits in the SFX experiment. When comparing the performance of seeded and unseeded microcrystals, it occurs that the number of hits increased considerably. While for the unseeded microcrystals, ∼4500 crystal hits were measured in a span of 3 h,14 for seeded microcrystals ∼17000 usable crystal hits were obtained in the same measurement time.6 Second, improving the jet led to improved illumination conditions. This was necessary to study the different S-states in the catalytic cycle of dPSIIcc. With the seeded microcrystals, we were successful in getting XRD data for several S-states, namely, S1, S3 (2F), S3' (3F + 250 μs), and S0 (3F).6 The experimental details of formation of each S-state can be found in Ref. 6. Briefly, O2 detection via membrane-inlet mass spectrometry (MIMS) was used for optimizing the S-state turnover in the capillary flow sample delivery system. The required light intensity for efficient turnover was determined from this experiment. Simultaneous collection of X ray emission spectroscopy (XES) and XRD data provided information about the electronic and geometric structure of the active site.6 Third, we also observed an improvement in the quality of the XRD data we collected. Microcrystals from the unseeded protocol resulted in maximum diffraction spots recorded out to 4.1 Å, but due to the large heterogeneity and overall lower hit rates, the collected datasets were only complete to a resolution of 5.7 Å for the S1 and 5.9 Å for the 1F (S2) state.14 Although the maximum resolution of the observed Bragg spots was similar when using the seeded microcrystals (clear spots observed to a resolution of ∼4.1 Å, with thermal diffuse scattering extending well to ∼3.0 Å), the overall diffraction quality and the distribution of diffraction spots were shifted towards higher resolution. This allowed to collect data sets of different states with improved resolution, S1 at 4.9 Å, S3 (2F) at 4.5 Å, S3' (3F + 250 μs) at 5.2 Å, and S0 (3F) at 4.6 Å in dPSIIcc, in roughly the same measurement time as was needed for the lower quality data sets collected from the unseeded crystals.6
IV. SUMMARY
In this study, microseeding is introduced to improve microcrystallization of the dimeric PSII core complex. Several different seeding techniques were evaluated for their potential to improve the yield and quality of dPSIIcc microcrystals. The double seeding protocol, using two subsequent microseeding steps, proved to be the best suited protocol. As a result of a high yield of monodisperse microcrystals, there were marked improvements in the stability of the jet and the resolution of the XRD data.
ACKNOWLEDGMENTS
This work was supported by NIH Grant No. GM055302 (V.K.Y) for PSII biochemistry, structure, and mechanism; the Director, Office of Science, Office of Basic Energy Sciences (OBES), Division of Chemical Sciences, Geosciences, and Biosciences (CSGB) of the Department of Energy (DOE) under Contract No. DE-AC02-05CH11231 (J.Y. and V.K.Y) for X-ray methodology and instrumentation. The DFG-Cluster of Excellence “UniCat” coordinated by the Technische Universität Berlin and Sfb1078, TP A5 (A.Z., M.I., and M.B.); the Alexander von Humboldt Foundation (J.K.); and the Human Frontiers Science Project Award No. RGP0063/2013 (J.Y. and A.Z.). We thank the staff at LCLS/SLAC and the staff at ALS (BL5.0.2) and BESSY for support of synchrotron experiments. Portions of this research were carried out at the Linac Coherent Light Source (LCLS) at the SLAC National Accelerator Laboratory. LCLS is an Office of Science User Facility operated for the U.S. Department of Energy Office of Science by Stanford University. We thank I. Seuffert and D. DiFiore (Sfb1078, project A5) for their excellent technical assistance.
References
- 1. Krogh A., Larsson B., Von Heijne G., and Sonnhammer E. L., “ Predicting transmembrane protein topology with a hidden Markov model: Application to complete genomes,” J. Mol. Biol. 305, 567–580 (2001). 10.1006/jmbi.2000.4315 [DOI] [PubMed] [Google Scholar]
- 2. Overington J. P., Al-Lazikani B., and Hopkins A. L., “ How many drug targets are there?,” Nat. Rev. Drug Discovery 5, 993–996 (2006). 10.1038/nrd2199 [DOI] [PubMed] [Google Scholar]
- 3. Carpenter E. P., Beis K., Cameron A. D., and Iwata S., “ Overcoming the challenges of membrane protein crystallography,” Curr. Opin. Struct. Biol. 18, 581–586 (2008). 10.1016/j.sbi.2008.07.001 [DOI] [PMC free article] [PubMed] [Google Scholar]
- 4. Cusack S. et al. , “ Small is beautiful: Protein micro-crystallography,” Nat. Struct. Mol. Biol. 5, 634–637 (1998). 10.1038/1325 [DOI] [PubMed] [Google Scholar]
- 5. Gruner S. M., Bilderback D., Bazarov I., Finkelstein K., Krafft G., Merminga L., Padamsee H., Shen Q., Sinclair C., and Tigner M., “ Energy recovery linacs as synchrotron radiation sources,” Rev. Sci. Instrum. 73, 1402–1406 (2002). 10.1063/1.1420754 [DOI] [PubMed] [Google Scholar]
- 6. Kern J. et al. , “ Taking snapshots of photosynthetic water oxidation using femtosecond X-ray diffraction and spectroscopy,” Nat. Commun. 5, 4371 (2014). 10.1038/ncomms5371 [DOI] [PMC free article] [PubMed] [Google Scholar]
- 7. Tenboer J. et al. , “ Time-resolved serial crystallography captures high-resolution intermediates of photoactive yellow protein,” Science 346, 1242–1246 (2014). 10.1126/science.1259357 [DOI] [PMC free article] [PubMed] [Google Scholar]
- 8. Renger G., “ Light induced oxidative water splitting in photosynthesis: Energetics, kinetics and mechanism,” J. Photochem. Photobiol., B 104, 35–43 (2011). 10.1016/j.jphotobiol.2011.01.023 [DOI] [PubMed] [Google Scholar]
- 9. Kok B., Forbush B., and McGloin M., “ Cooperation of charges in photosynthetic O2 evolution–I. A linear four step mechanism,” Photochem. Photobiol. 11, 457–475 (1970). 10.1111/j.1751-1097.1970.tb06017.x [DOI] [PubMed] [Google Scholar]
- 10. Umena Y., Kawakami K., Shen J.-R., and Kamiya N., “ Crystal structure of oxygen-evolving photosystem II at a resolution of 1.9 A,” Nature 473, 55–61 (2011). 10.1038/nature09913 [DOI] [PubMed] [Google Scholar]
- 11. Yano J. et al. , “ X-ray damage to the Mn4Ca complex in single crystals of photosystem II: A case study for metalloprotein crystallography,” Proc. Natl. Acad. Sci. U. S. A. 102, 12047–12052 (2005). 10.1073/pnas.0505207102 [DOI] [PMC free article] [PubMed] [Google Scholar]
- 12. Gloeckner C., Kern J., Broser M., Zouni A., Yachandra V. K., and Yano J., “ Structural changes of the oxygen-evolving complex in photosystem II during the catalytic cycle,” J. Biol. Chem. 288, 22607–22620 (2013). 10.1074/jbc.M113.476622 [DOI] [PMC free article] [PubMed] [Google Scholar]
- 13. Kern J. et al. , “ Room temperature femtosecond X-ray diffraction of photosystem II microcrystals,” Proc. Natl. Acad. Sci. U. S. A. 109, 9721–9726 (2012). 10.1073/pnas.1204598109 [DOI] [PMC free article] [PubMed] [Google Scholar]
- 14. Kern J. et al. , “ Simultaneous femtosecond X-ray spectroscopy and diffraction of photosystem II at room temperature,” Science 340, 491–495 (2013). 10.1126/science.1234273 [DOI] [PMC free article] [PubMed] [Google Scholar]
- 15. Kupitz C. et al. , “ Serial time-resolved crystallography of photosystem II using a femtosecond X-ray laser,” Nature 513, 261–265 (2014). 10.1038/nature13453 [DOI] [PMC free article] [PubMed] [Google Scholar]
- 16. Suga M. et al. , “ Native structure of photosystem II at 1.95 A resolution viewed by femtosecond X-ray pulses,” Nature 517, 99–103 (2015). 10.1038/nature13991 [DOI] [PubMed] [Google Scholar]
- 17. Bergfors T., “ Seeds to crystals,” J. Struct. Biol. 142, 66–76 (2003). 10.1016/S1047-8477(03)00039-X [DOI] [PubMed] [Google Scholar]
- 18. McPherson A., Crystallization of Biological Macromolecules ( Cold Spring Harbor Laboratory Press, 1999). [Google Scholar]
- 19. Schmidt M., “ Mix and inject: Reaction initiation by diffusion for time-resolved macromolecular crystallography,” Adv. Condens. Matter Phys. 2013, 167276. 10.1155/2013/167276 [DOI] [Google Scholar]
- 20. Kern J., Loll B., Lüneberg C., DiFiore D., Biesiadka J., Irrgang K.-D., and Zouni A., “ Purification, characterisation and crystallisation of photosystem II from Thermosynechococcus elongatus cultivated in a new type of photobioreactor,” Biochim. Biophys. Acta, Bioenerg. 1706, 147–157 (2005). 10.1016/j.bbabio.2004.10.007 [DOI] [PubMed] [Google Scholar]
- 21. Sierra R. G. et al. , “ Nanoflow electrospinning serial femtosecond crystallography,” Acta Crystallogr., Sect. D: Biol. Crystallogr. 68, 1584–1587 (2012). 10.1107/S0907444912038152 [DOI] [PMC free article] [PubMed] [Google Scholar]
- 22. Boutet S. and Williams G. J., “ The coherent x-ray imaging (CXI) instrument at the Linac Coherent Light Source (LCLS),” New J. Phys. 12, 035024 (2010). 10.1088/1367-2630/12/3/035024 [DOI] [Google Scholar]
- 23. Siewert F., Buchheim J., Boutet S., Williams G. J., Montanez P. A., Krzywinski J., and Signorato R., “ Ultra-precise characterization of LCLS hard X-ray focusing mirrors by high resolution slope measuring deflectometry,” Opt. Express 20, 4525–4536 (2012). 10.1364/OE.20.004525 [DOI] [PubMed] [Google Scholar]
- 24. Koerner L. J., Philipp H. T., Hromalik M. S., Tate M. W., and Gruner S. M., “ X-ray tests of a pixel array detector for coherent x-ray imaging at the Linac Coherent Light Source,” J. Instrum. 4, P03001 (2009). 10.1088/1748-0221/4/03/P03001 [DOI] [Google Scholar]
- 25. Ibrahim M., “ Quality Improvement of Photosystem II Microcrystal for Femtosecond X-ray Crystallography,” M.S. dissertation ( Technical University Berlin, 2013). [Google Scholar]
- 26. Müh F. and Zouni A., “ Extinction coefficients and critical solubilisation concentrations of photosystems I and II from Thermosynechococcus elongatus,” Biochim. Biophys. Acta, Bioenerg. 1708, 219–228 (2005). 10.1016/j.bbabio.2005.03.005 [DOI] [PubMed] [Google Scholar]
- 27. Shen J.-R. and Kamiya N., “ Crystallization and the crystal properties of the oxygen-evolving photosystem II from Synechococcus vulcanus,” Biochemistry 39, 14739–14744 (2000). 10.1021/bi001402m [DOI] [PubMed] [Google Scholar]
- 28. Guskov A., Kern J., Gabdulkhakov A., Broser M., Zouni A., and Saenger W., “ Cyanobacterial photosystem II at 2.9-Å resolution and the role of quinones, lipids, channels and chloride,” Nat. Struct. Mol. Biol. 16, 334–342 (2009). 10.1038/nsmb.1559 [DOI] [PubMed] [Google Scholar]
- 29. Zouni A., Kern J., Frank J., Hellweg T., Behlke J., Saenger W., and Irrgang K.-D., “ Size determination of cyanobacterial and higher plant photosystem II by gel permeation chromatography, light scattering, and ultracentrifugation,” Biochemistry 44, 4572–4581 (2005). 10.1021/bi047685q [DOI] [PubMed] [Google Scholar]
- 30. Broser M., “ Purification, crystallization and structural analysis of the monomeric photosystem II core complex from Thermosynechococcus elongatus,” PhD dissertation, Technical University Berlin, 2010. [Google Scholar]


