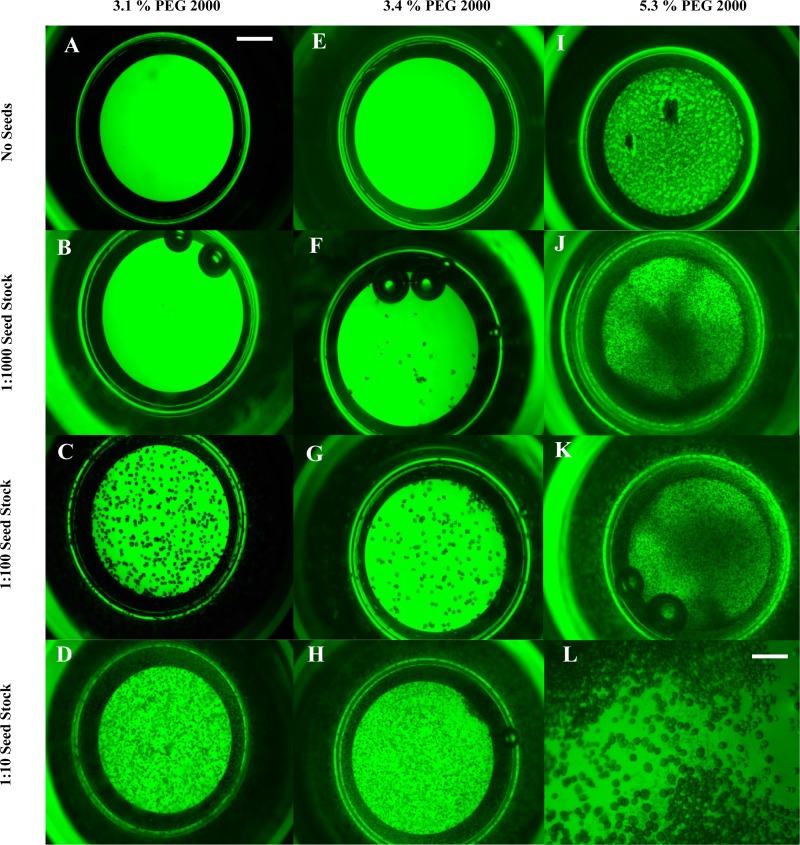
FIG. 2.
Three crystallization setups showing the effect of seed concentration on crystal size and crystal number. The dPSIIcc protein concentration was 7.6 mg/ml (0.76 mM Chla) in all. A, B, C, and D—the PEG 2000 concentration was 3.1%. E, F, G, and H—the PEG concentration was 3.4%. I, J, K, and L—the PEG 2000 concentration was 5.3%. A, E, and I were made without adding any seeds. B, F, J seed stock 1:1000 was used, C, G, seed stock 1:100 was used, and D, H, L seed stock 1:10 was used. In J, precipitations start to appear, while in J and K, there are many microcrystals besides precipitations. L shows a closer look at K to show the microcrystals and the precipitations. The scale bar is 500 μm for A–H and 125 μm for L.

