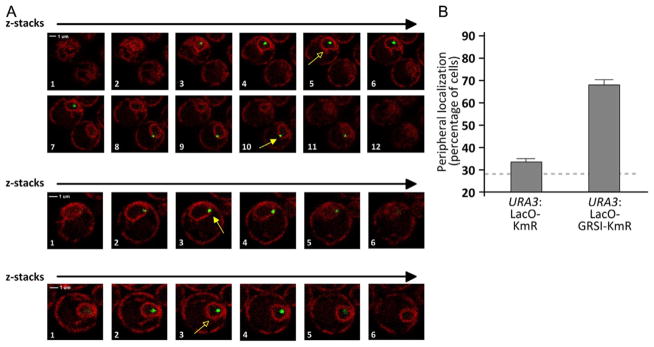
Figure 21.2. Quantifying Gene Localization at the Nuclear Periphery in Live Cells.
(A) Individual z-slices from confocal microscopy of yeast cells having the LacO array integrated at URA3 and expressing both GFP-LacI and mCherry on the endoplasmic reticulum/nuclear envelope. The slice corresponding to the brightest, most focused dot was scored (indicated with yellow arrows). Cells in which the center of the green dot does not colocalize with the nuclear envelope were scored as “OFF” (open arrowheads). Cells in which the center of the green dot colocalizes with the nuclear periphery were scored as “ON” (closed arrowheads). (B) Histogram depicting the localization of the URA3 locus with either the LacO array and KmR cassette inserted in place of the Ampr gene (as in Fig. 21.1B) or with the LacO array and the KmR gene with the GRSI zip code inserted in place of the Ampr gene. Three biological replicates of 30–50 cells each were scored for each strain. For reference, the mean peripheral localization of the URA3 gene from Brickner and Walter (2004) is shown with the dashed line.

