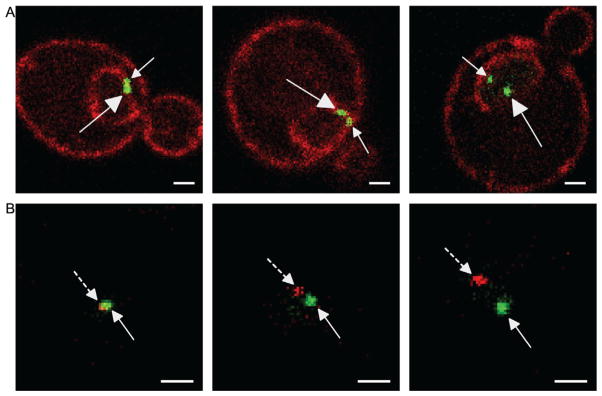
Figure 21.3. Two-Dot Experiments in Live Yeast Cells for Studying Interchromosomal Clustering by Confocal Microscopy.
For both panels, white scale bar is 1 μm and distances between dots increase from left to right. (A) Examples from the GFP-LacI two-dots assay. This is a diploid cell having both copies of the GAL1 gene marked with the LacO array. The dots are indicated with arrows that have closed arrowheads and straight lines. The large arrows indicate the localization of the large dot (LacO256) and the small arrows indicate the localization of the smaller dot (LacO128). (B) Examples of the RFP-LacI+GFP-TetR two-dot assay. The green GFP-TetR dot marks the TetO array integrated at INO1 and the RFP-LacI red dot marks the LacO array and component(s) of the INO1 gene integrated at URA3. The green dots are indicated with arrows that have closed arrowheads and the red dots are indicated with arrows that have closed arrowheads and dashed lines.

