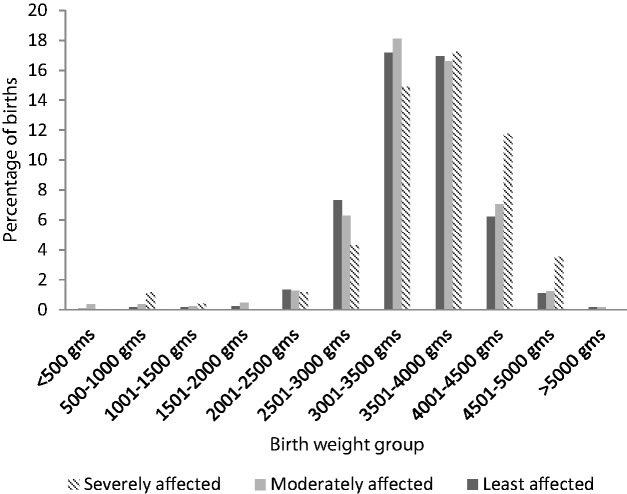
Figure 2.
Plot of the percentage of births in each weight category by fire exposure in 2003, a chi-square test indicates that these differences are significant at P = 0.02. In the severely affected area, there were increases in birth weights between 4000 and 5000 g, which were not offset by the increases in birth weights between 500 and 1500 g

