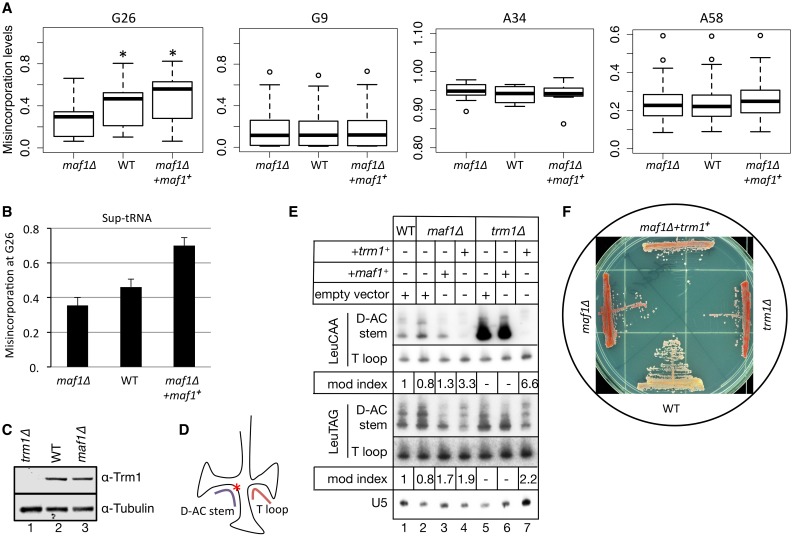
Fig 4. M2 2G26 hypomodification is responsible for the maf1-antisuppression paradox.
A) Box plots showing misincorporations in maf1Δ, WT and maf1Δ+maf1 + strains; G26 box shows misincorporations for 36 tRNAs with G at position 26 (*paired student t test p value <0.001); the G9, A34 and A58 box plots show misincorporations for the tRNA subsets with the corresponding nucleotide identities. B) G26 misincorporations for unique reads mapping to sup-tRNASerUCA in maf1Δ, WT and maf1Δ+maf1 + strains. C) Western blot analysis of Trm1 levels in the strains indicated above the lanes; tubulin served as a loading control. D) Cartoon showing G26 as red asterisk and the two probes used for PHA26 (positive hybridization in the absence of G26 modification) assay. E) PHA26 northern blot assay showing sequential probings with oligos to the two different tRNAsLeu indicated to the left; strains are indicated above the lanes and over-expression plasmids are indicated as +trm1 + +maf1 + or the control, empty vector. Quantification of T-loop/D-AC stem probe signal is expressed as a modification index where the value of the control, in this case lane 1, set to a value of 1.0, is shown below the lanes of each tRNA panel. F) tRNA-mediated suppression (TMS) for WT, maf1Δ, trm1Δ, and maf1Δ+trm1 + cells.

