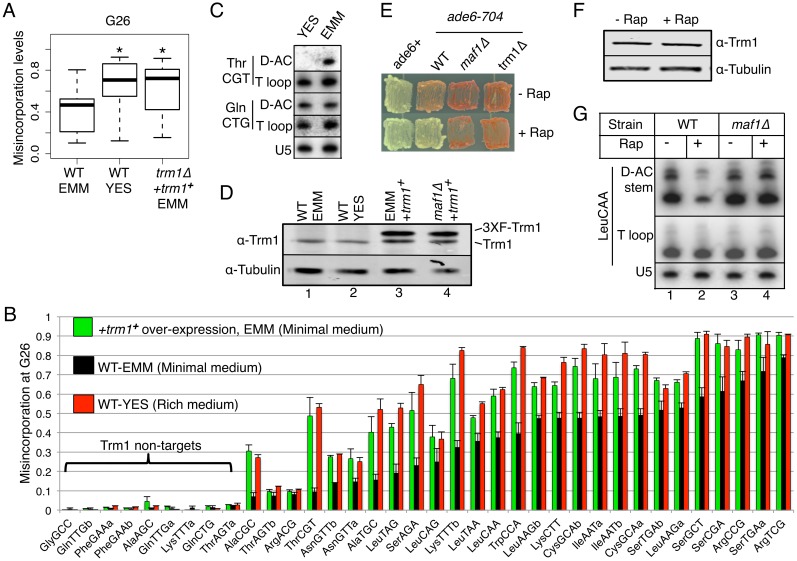
Fig 6. M2 2G26 is regulated by nutrient/growth conditions.
A) Box plot showing G26 misincorporation levels in WT cells grown in minimal (EMM), rich (YES) media, and trm1 + over-expression (trm1Δ+trm1 +) in EMM as indicated (*paired student t test p value <0.001 relative to WT-EMM). B) Bar graph showing G26 misincorporation levels in WT cells in minimal (EMM) and rich (YES) media and +trm1 + over-expression in EMM. C) PHA26 assay for tRNAThrCGT in minimal (EMM) and rich (YES) media. D) Western blot analysis for Trm1 in WT cells in minimal (EMM) and rich (YES) media (lanes 1, 2), and +trm1 + over-expression in EMM (lane 3), as well as maf11Δ+trm1 + in EMM (lane 4); tubulin serves as a loading control. E) TMS assay for various strains in +/- rapamycin as indicated to the right. F) Western blot analysis for Trm1 in +/- rapamycin as indicated above the lanes; tubulin serves as a loading control. G) PHA26 assay on various strains in +/- rapamycin as indicated above the lanes.

