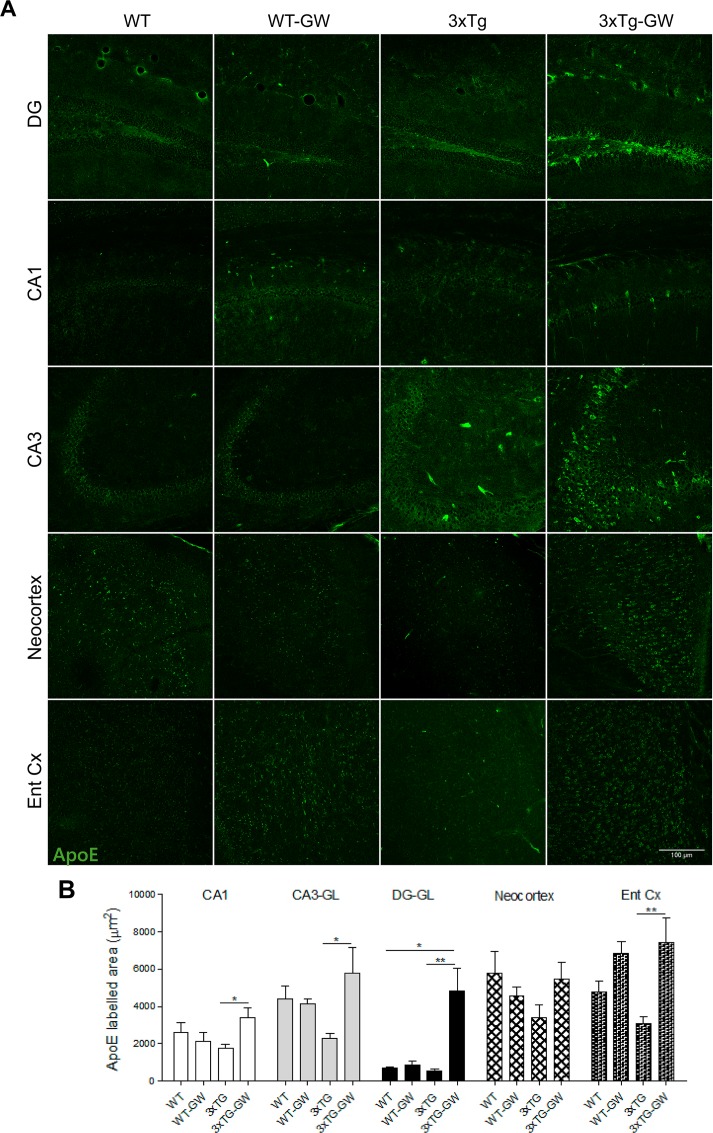
Fig 5. LXR agonist increased ApoE immunofluorescence particularly on 3xTg-AD mice.
(A) Representative micrographs of ApoE immunofluorescence (Green) using confocal microscopy in the different analysed regions: Hippocampus (DG, CA3 and CA1) Entorhinal cortex (Ent Cx) and Neocortex in treated, untreated WT mice and 3xTg-AD mice. (B) Comparative analysis between treatment groups of the immunoreactive area occupied by ApoE, the data is expressed as mean ± S.E.M. Statistical analysis was performed by one-way ANOVA followed by Bonferroni post test.*: p<0.05, **: p<0.01. n = 4 per group.

