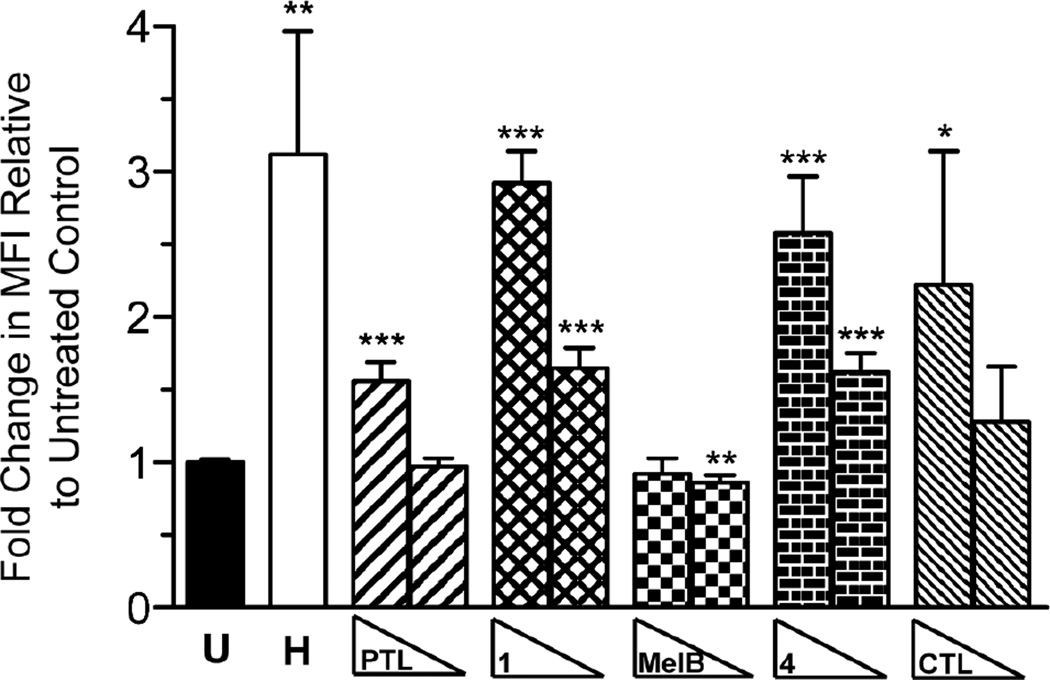
Figure 5.
Intracellular ROS induction by PTL and analogues. TEX cells were treated with hydrogen peroxide H (100 µM) and PTL, 1, MelB, 4, CTL (100, 25 µM) and ROS activity was measured by flow cytometry using CellROX Green reagent. The median fluorescence intensity (MFI) of each sample was normalized to the untreated control and averaged. Values are mean MFI ± S.D. (n • 3 analyses). * p = 0.05, ** p ≤ 0.01, *** p ≤ 0.001 in comparison to untreated control.

