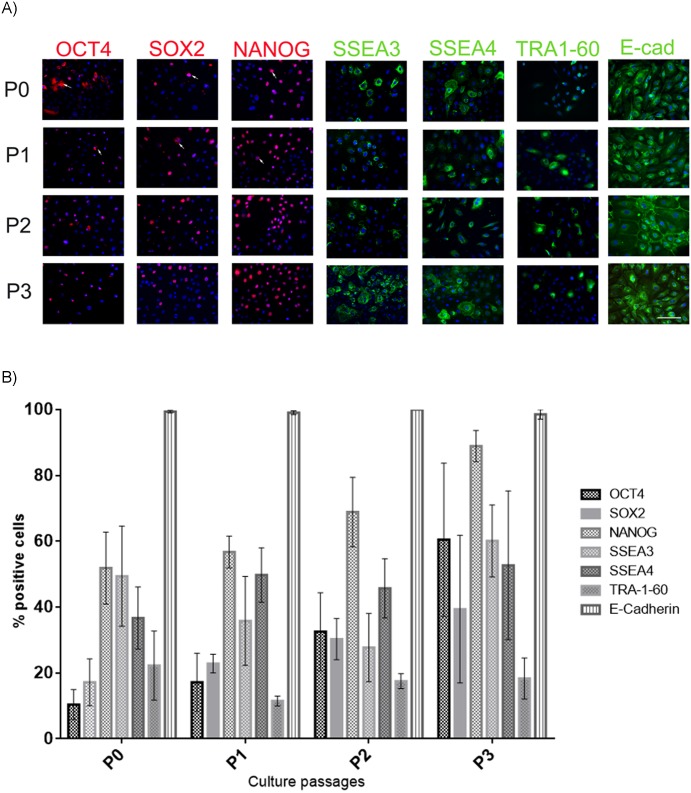
Fig 2. hAEC display the pluripotent stem cell markers.
(A) Representative micrographs at 20X from hAEC at different passages (P0-P3) immunostained for OCT4 (red), SOX2 (red), NANOG (red), SSEA3 (green), SSEA4 (green), TRA-1-60 (green) and E-cadherin (green); the nuclei were stained with DAPI (blue). Arrow indicate that the marker was found in the cytoplasm. (B) Graph shows the percentage of hAEC positive for the different pluripotent markers. Results are expressed as percentages of means ± S.E.M. from 9 fields counted in duplicate from five independent experiments. Scale bar 50 μm.

