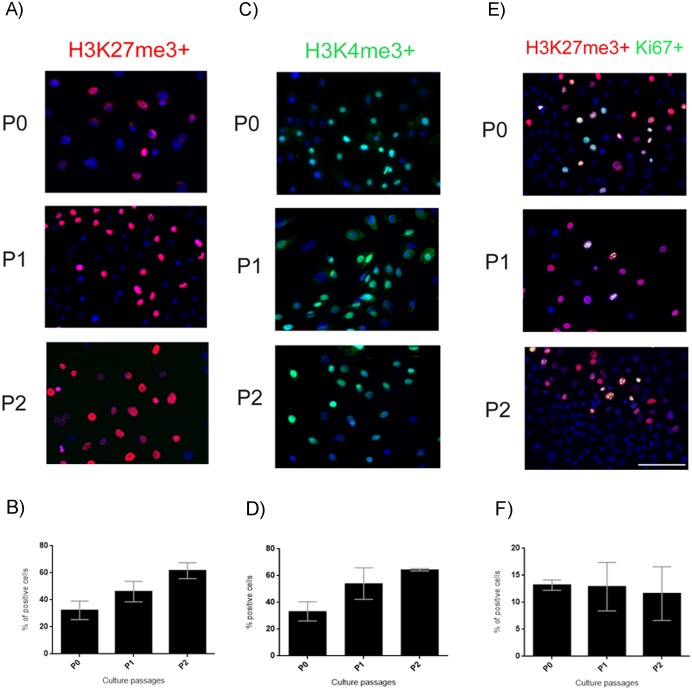
Fig 5. Epigenetic state of hAEC.
(A) Representative micrographs at 20x from hAEC at P0-P2 immunostained for H3K27me3 (red); the nuclei were stained with DAPI (blue). (B) Graph showing the percentage of hAEC that present the H3K27me3 mark. (C) Representative micrographs at 20x from hAEC at P0-P2 immunostained for H3K24me3 (green); the nuclei were stained with DAPI (blue). (D) Graph showing the percentage of hAEC that present the H3K4me3 mark. (E) Representative micrographs at 20x from hAEC at P0-P2 immunostained for H3K27me3 (red) and Ki67 (green); the nuclei were stained with DAPI (blue). (F) Percentage of hAEC positive for both H3K27me3 and Ki67. Results are expressed as percentages of means ± S.E.M. from 9 fields counted in duplicate from three independent experiments. Scale bars, 50 μm.

