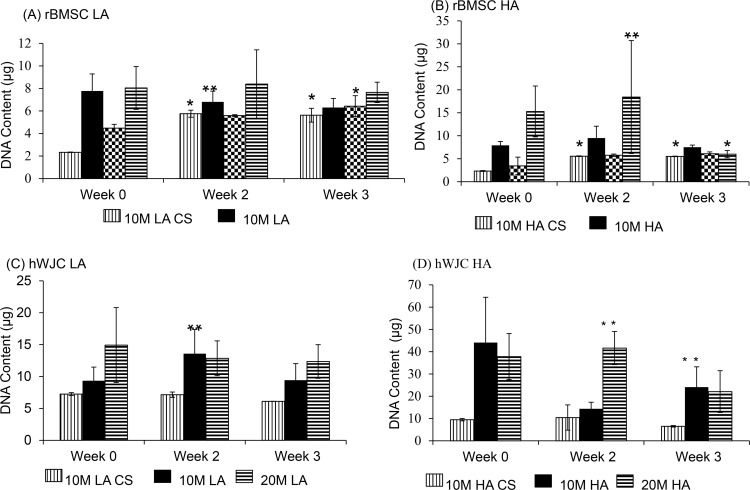
Fig 4. DNA content for all the rBMSC and hWJC groups at 0, 2, and 3 weeks expressed as DNA (μg/ scaffold).
(A) DNA content of all the rBMSC LA and LA CS groups. (B) DNA content of all the rBMSC HA and HA CS groups. (C) DNA content of all the hWJC LA and LA CS groups. (D) DNA content of all the hWJC HA and HA CS groups. All aggregate groups had statistically significant increase in DNA over week 0, HA groups had significantly higher values compared to the CS control groups at week 3. Values are reported as mean ± standard deviation, n = 4. (*) represents statistically significant difference from the week 0 value. (#) represents statistically significant difference from the previous time point and (**) represents statistically significant difference from the control at that time point (p < 0.05).

