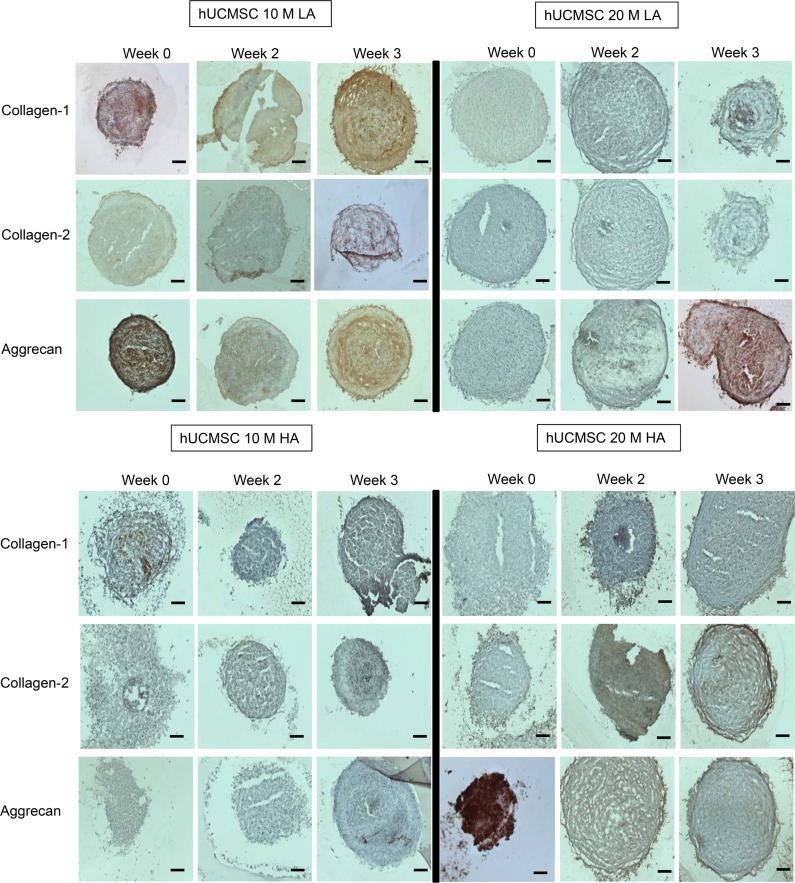
Fig 10. Representative images for immunohistochemistry analysis for collagen I, collagen II, and aggrecan staining for hWJC groups at week 0, 2, and 3.
The 10M LA and 20M HA groups at week 0 displayed the highest staining intensity for aggrecan and 20M LA group at week 3 displayed the highest staining intensity for aggrecan. Scale bar = 200 μm.

