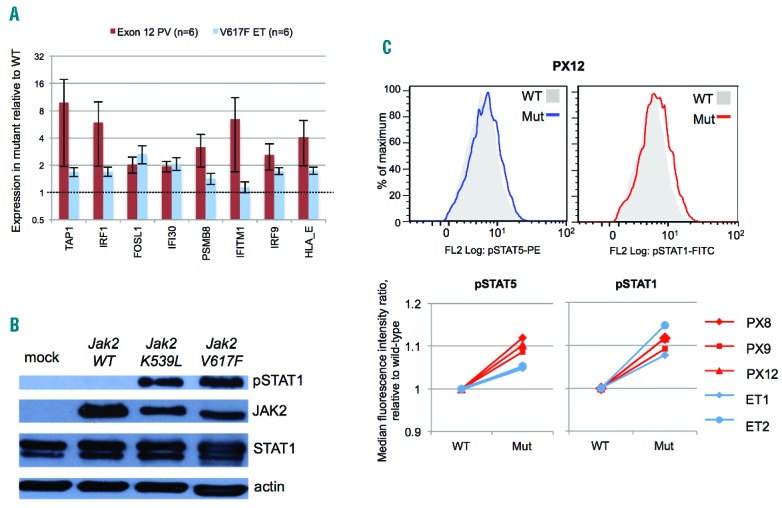
Figure 2.

STAT1 activation in association with JAK2 exon 12 mutations. (A) Expression levels of 8 IFNγ target genes11 measured in cDNA from BFU-E colonies from polycythemia vera (PV) patients with JAK2 exon 12-heterozygous colonies and essential thrombocythemia (ET) patients with JAK2V617F-heterozygous colonies, using Fluidigm real-time PCR. Colonies were all grown at 0.1 U/mL erythropoietin. Data were normalized to a housekeeping gene (HPRT1) and expressed as fold change between expression in mutant and wild-type samples. Histograms show mean +/− SEM. (B) Western immunoblot analyses for phos-pho-STAT1 (tyrosine-701) of JAK2-null γ2A cells mock transfected or transfected with expression vectors for murine wild-type Jak2, Jak2K539L or Jak2V617F. The experiment was performed twice and representative results are shown. (C) Intracellular flow cytometry for phospho-STAT5 (pSTAT5, tyrosine-694) and phos-pho-STAT1 (pSTAT1, tyrosine-701) in BFU-E colonies. Colonies were pooled by genotype and erythroblasts gated on forward scatter and side scatter. Histograms for wild-type and mutant colonies are shown for pSTAT5 (left) and pSTAT1 (right) for patient PX12 (upper panel). Median fluorescence intensity ratios (relative to wild-type) for 3 patients with JAK2 exon 12-mutated PV (red) and 2 with JAK2V617F-positive ET (blue) are summarized in the panels below.
