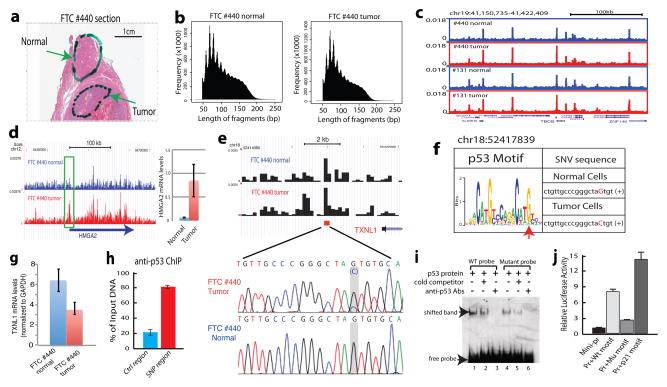
Figure 4. Application of Pico-Seq to FFPE patient tissue sections reveals novel pathophysiological information on thyroid cancers.
a. A full view of a Hematoxylin and Eosin stained slide of FTC #440. Cells recovered from the highlighted areas were subject to Pico-Seq analysis.
b. Typical periodic DNase cleavage patterns of nucleosomes were detected for both the normal and tumor cells by Pico-Seq.
c. Genome Browser image displaying the Pico-Seq profiles of the normal (blue) and tumor (red) cells from two thyroid carcinomas #440 and #131.
d. Genome Browser image showing the increased chromatin accessibility of the HMGA2 promoter in the tumor cells of FTC #440 (left panel). qRT-PCR analysis shows the increased HMGA2 mRNA level in the tumor cells (right panel).
e. A single nucleotide variation (SNV) was identified at a DHS near the 3′ end of the TXNL1 gene in the tumor cells of FTC #440. The SNV location is indicated by the red square. The SNV was confirmed by Sanger sequencing (highlighted region).
f. The G to C change in tumor cells negatively impacts p53 target motif. The SNV in the p53 motif logo is indicated by a red arrowhead.
g. The G to C change in the tumor cells is correlated with decreased expression of TXNL1 by qRT-PCR analysis.
h. p53 is bound to the SNV region in a human thyroid cell line by ChIP-qPCR analysis.
i. The G-to-C change decreases p53 binding affinity in vitro by gel shift assay.
j. The G-to-C change reduces the activity of the p53 motif to activate a reporter promoter in vivo. The p53 motif from the p21 promoter was used as a positive control.

