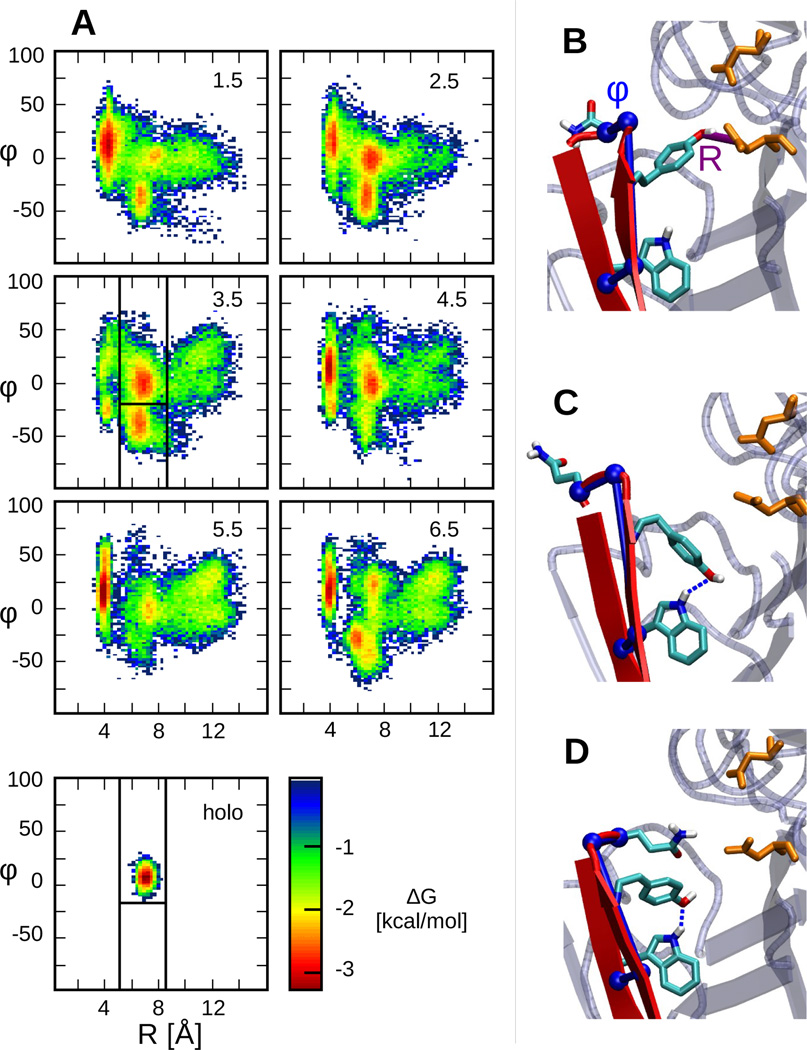
Figure 3.
pH-dependent conformational states of BACE1. A. Free energy surface of apo BACE1 as a function of R and φ at various pH conditions indicated on the upper right corner. The lower left panel presents the FES of holo BACE1 at pH 4.5. The free energy is calculated using −kTlnP(R;φ), where k is the Boltzmann constant and T is the temperature. Vertical and horizontal lines in the panel for pH 3.5 define the various states. B. Representative snapshot of the Tyr-inhibited state. The order parameters, R and φ defined in the main text, are shown in purple and blue, respectively. C. Representative snapshot of the binding-competent state. D. Representative snapshot of the Gln-inhibited state.

