
FIGURE 2.
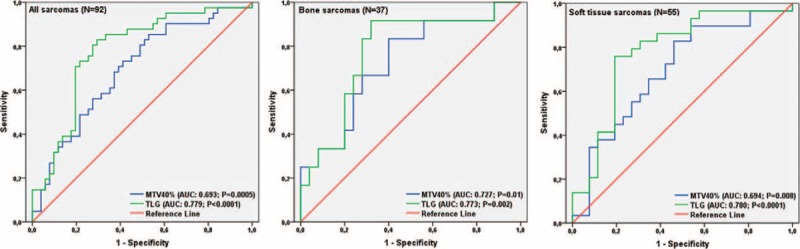
ROC curve analysis of all included patients (N = 92) and subgroups of patients with BS (N = 37) or STS (N = 55), with measurements of the accuracy of metabolic tumor volume with a preset threshold of 40% of the maximum standardized uptake value of primary tumor (MTV40%) and total lesion glycolysis (TLG) as prognostic variables. BS = bone sarcoma, MTV = metabolic tumor volume, ROC = receiver operating characteristic, STS = soft tissue sarcoma, TLG = total lesion glycolysis.