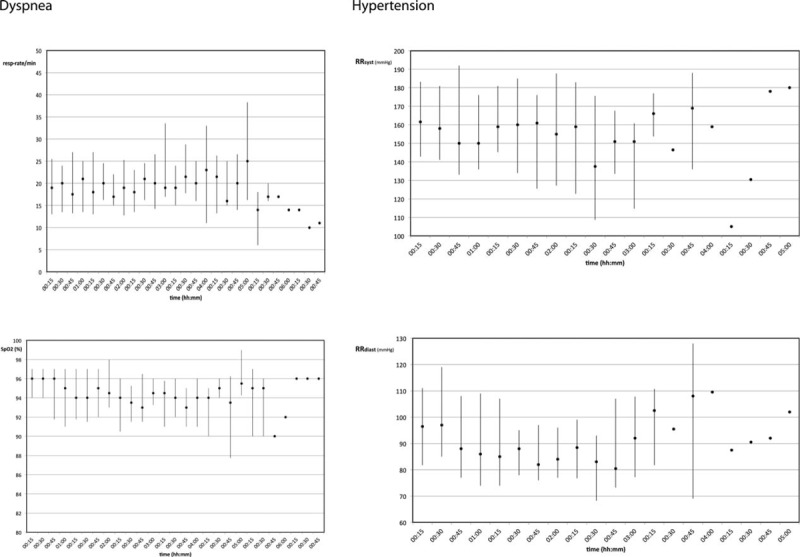
FIGURE 3.

Respiratory rate and SpO2 data from patients with dyspnea on the left (n = 25); blood pressure data (systolic and diastolic; n = 31) from patients with hypertension on the right; data are presented as median and their interquartile range. SpO2 = blood oxygen saturation.
