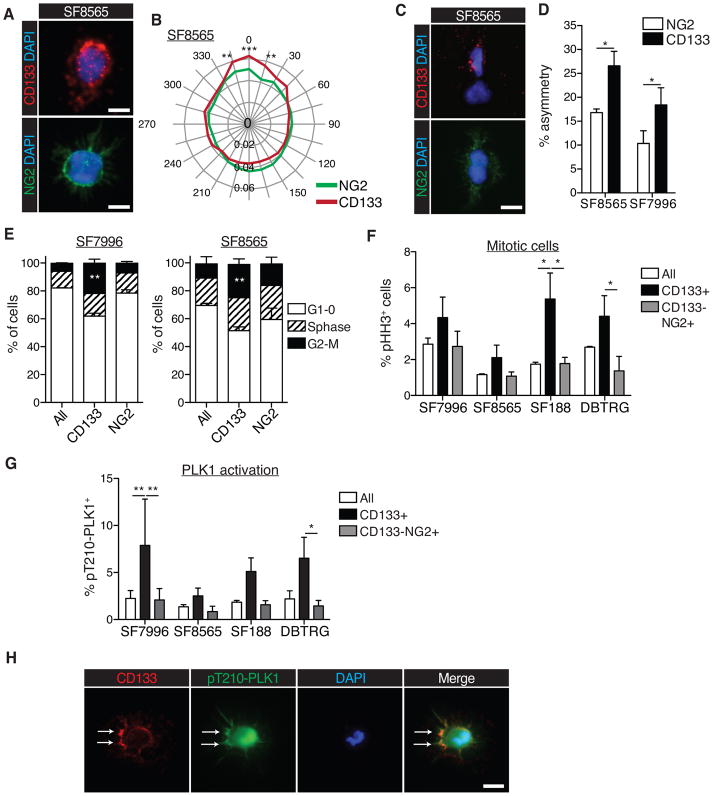
Figure 3. ACD is elevated and cell cycle dynamics are different in CD133+ cells, in relation to NG2+ cells.
(A) Representative image of polarized CD133 localization (red; top), unpolarized NG2 localization (green; bottom), and DAPI (blue; top and bottom), in SF8565 cells (scale bars represent 10μm).
(B) Radial plot showing quantification of CD133 and NG2 polarization. Quantification was performed using the Oval Profile plugin for ImageJ and expressed as a percentage of the grey value for each cell, aligned with the maximum at 0°; values are averaged across ≥30 cells/experiment (2-way ANOVA with Bonferroni post-hoc test; *p≤0.05; **p≤0.01; ***p≤0.001; error bars represent SEM)
(C) Pair assays visualizing the asymmetric distribution of CD133 (red; top panel), symmetric distribution of NG2 (green; bottom panel) and DAPI (blue; top and bottom), in SF8565 cells (scale bars represent 10μm).
(D) Quantification of asymmetric division frequency of CD133+ and NG2+ cells from two different cell lines (n=4 individual experiments per cell line, ≥30 cell pairs were scored per experiment; 2-way paired t-test; error bars represent SEM; *p≤0.05).
(E) Cell cycle analysis of two different GBM cell lines, stratified by expression of CD133 and NG2, and showing an increase in CD133+ cells in G2/M phase. NG2=CD133−NG2+ cells (n=3 individual experiments per cell line, 2-way ANOVA with Bonferroni post-hoc test; error bars represent SEM; **p<0.005).
(F) Quantification of flow cytometry analyses to detect pHH3 in cell lines stratified by expression of CD133 and NG2 (n=2 individual experiments; 2-way ANOVA with Bonferroni post-hoc test, error bars represent SEM; *p<0.05).
(G) Flow cytometry analysis to detect activated phospho-PLK1 (pT210-PLK1) in cell lines stratified by expression of CD133 and NG2. CD133+ cells show elevated levels of activated PLK1 (n=3 individual experiments; 2-way ANOVA with Bonferroni post-hoc test, error bars represent SEM; *p≤0.05; **p≤0.01).
(H) Immunocytochemistry to detect phosphorylated form of PLK at T120 residue (pT210-PLK; green), CD133 (red), and DAPI staining (blue). Arrows depict enriched localization of activated PLK1 and co-localization with CD133 at the cortex (scale bar represents 10μm).

