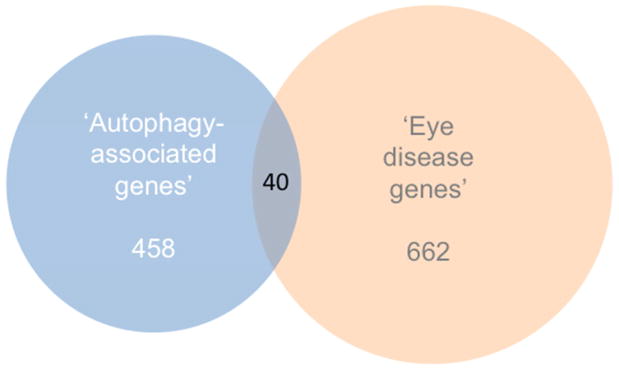
Fig. 2.
Venn diagram illustrating the overlap of ‘autophagy-asociated genes’ (see list in Supplementary Table 1) and NEIBank’s ‘eye disease genes’. The Venn diagram was produced using http://www.stefanjol.nl/venny#ref1 and then redrawn for higher resolution.

