Figure 4.

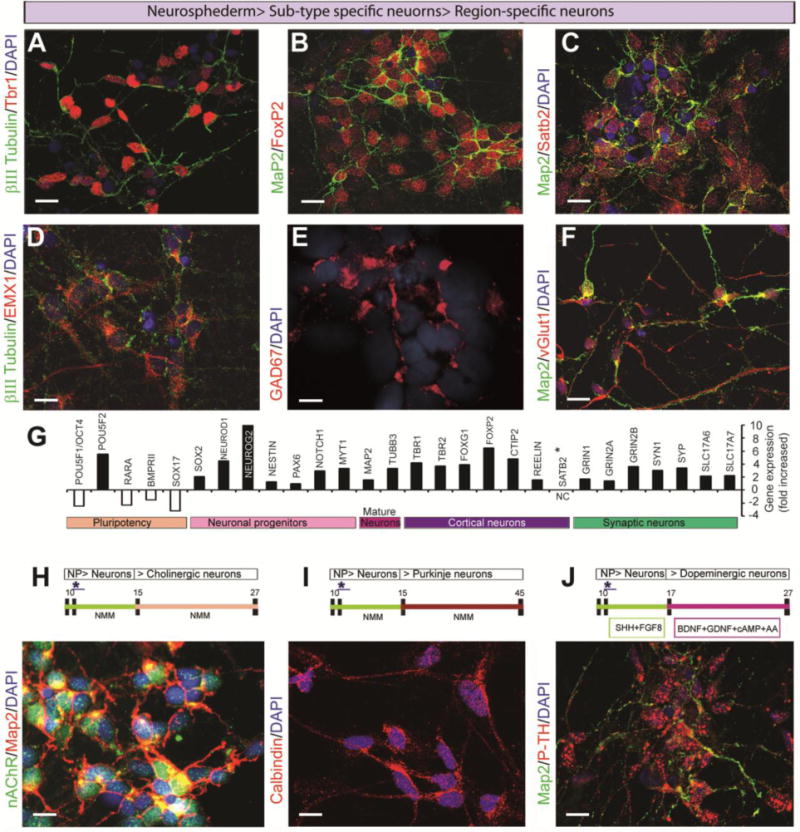
Generation of sub-type- and region-specific neurons from the neurospheres. The confocal images of the cortical layer-specific neurons were produced by double staining with (A) βIII tubulin/TBR1 (green/red), (B) MAP2/FOXP2 (green/red), and (C) cortical layer 2 (SATB2, red). These neurons appeared over 2 weeks after neuronal induction, and (D) cortical pyramidal neurons (EMX1, red) also appeared from the βIII tubulin-stained (green) neurosphederm-derived neuronal cultures. (E) Interneuron expression was analyzed by staining with the GAD67 marker (red). (F) The excitatory glutamatergic neuronal cells were observed with double staining for vGLUT1 (red) and MAP2 (green). (G) The bar graph represents the percentage of the fold increase in gene expression in the neurosphederm-derived neurons compared to the neuroectoderm-derived neurons. Gene expression analysis was performed using NanoString Technologies software as described in detail in the materials and methods. (H) The forebrain cholinergic neurons were detectable between 19–27 days in culture. These cells were confirmed by the presence of the nicotine acetyl choline receptor (nAChR, green) and a mature neuron marker (MAP2, red). (I) Purkinje neurons appeared between 40–45 days and expressed high levels of calbindin, a human Purkinje cell marker (red). (J) Dopaminergic neurons were detected between 25–27 days in the presence of additional supplements (see materials and methods). The dopaminergic neurons were identified by staining with antibodies to p-tyrosine hydroxylase (p-TH, red) and MAP2 (green). All of the images in this panel were captured by confocal microscopy. The nuclei are stained with DAPI. All scale bars, 25 μm.
