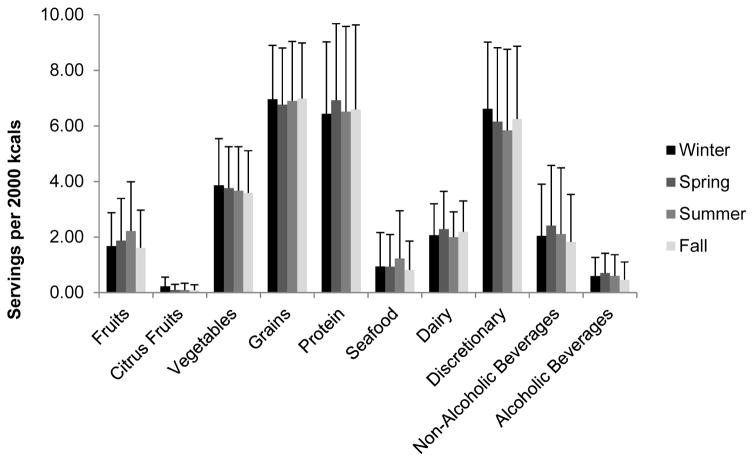
Figure 2.
Mean number of servings per 2000 kcals (adjusted for age, race, and BMI) of healthy volunteers (n=76) from the metropolitan Washington DC area. Data is reported as the number of servings per 2000 kcals and shown as means ± standard deviation. Data was derived from analysis of food records; winter (n=54), spring (n=60), summer (n=59), fall (n=54). Food groups included fruits (all fruit including citrus), citrus fruits, vegetables (excluding legumes), grains, protein (including legumes and seafood), seafood, dairy, discretionary (fats, oils, sugar, condiments), non-alcoholic beverages (excluding 100% fruit juice, dairy, and water), and alcoholic beverages. All p values were >0.05.

