
Figure 4.
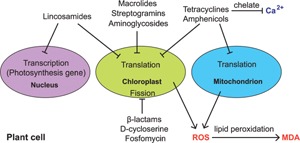
Schematic diagram of the impact of antibiotics on a hypothetical plant cell. For simplicity, all factors are presented in the same plant cell. Arrows indicate positive regulations and bars mean negative regulations. ROS, reactive oxygen species; MDA, malondialdehyde, is an end product of lipid peroxidation.