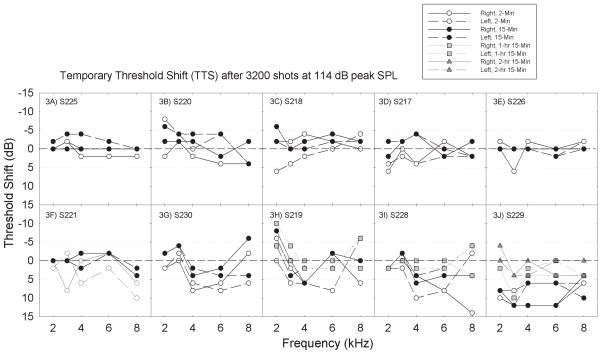
Figure 3.
Within subjects exposed to a given noise condition, there was significant individual variability. Individual subjects are plotted in panels 3A–3J, one subject per panel. Panels are sorted such that subjects with smaller changes are followed by subjects with larger changes. Subjects were followed until complete recovery was observed; subjects with larger threshold shifts were followed for longer periods than subjects with smaller shifts, based on time to recovery. The longest post-game monitoring interval was 2 hrs 15 mins (Figure 3J).

