Fig.1.
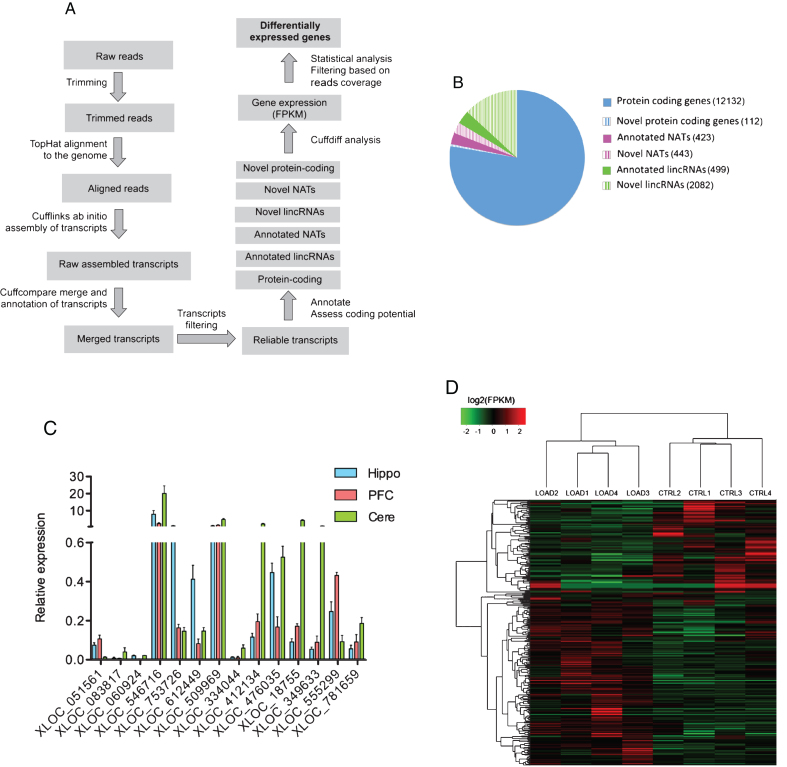
RNAseq analysis. A) Schematic representation of the bioinformatics pipeline we used for RNAseq data analysis. This experimentally validated computational approach is suitable for the accurate measurement of gene expression and to discover and annotate novel RNA transcripts. B) Pie chart showing the number of annotated and non-annotated RNA transcripts expressed in at least one of the sequenced hippocampi RNA samples. C) qRT-PCR analysis of novel non-annotated lncRNAs identified by RNAseq. β-ACTIN was used as endogenous control to normalize gene expression analysis. On the Y axe is depicted the expression of the analyzed gene relative to the housekeeping gene β-ACTIN. Error bars are S.D. Hippo: Hippocampus, PFC: Prefrontal Cortex, Cere: Cerebellum. D) Heatmap showing log2(FPKM) values and hierarchical clustering analysis for differentially expressed genes in LOAD versus control hippocampi.

