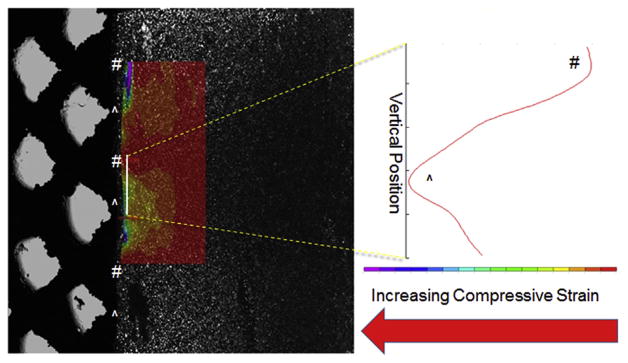
Fig. 5.
A representative composite of transmitted light and fluorescent light images, showing 4% agarose gel compressed against a cut 1200 μm pore titanium base (20% applied strain, cells seeded for speckle) with overlaid compressive strain map (left). Open pores abutting gel are marked with # and struts abutting gel are marked with ^. Compressive strain across the solid white line plotted (right) indicating increased compressive strain over struts (^) compared to pores (#).

