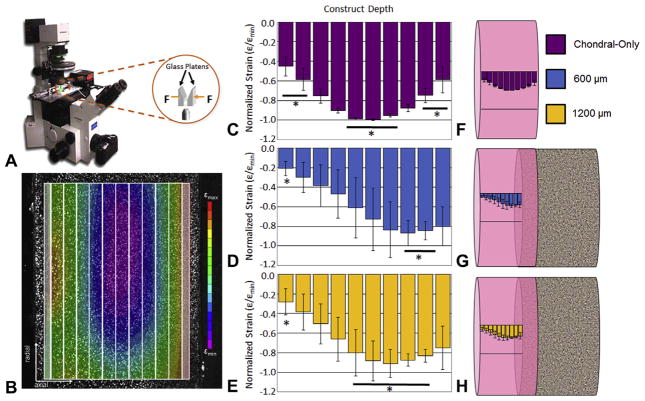
Fig. 8.
(A) Schematic of microscope-mounted depth-dependent testing setup, adapted from [44]. (B) Representative strain map of control construct showing “U-shape” profile with bins demarcated. Average strain profiles normalized by peak compressive strain for (C) chondral-only controls; and for osteochondral constructs grown on (D) 600; and (E) 1200 μm pore bases. Indicates significantly different groups (p ≤ 0.05). For each group, n = 3–4. (F and G) Respective average strain profiles contextualized on schematics of chondral-only and osteochondral constructs. Data are expressed as mean ± standard deviation.

