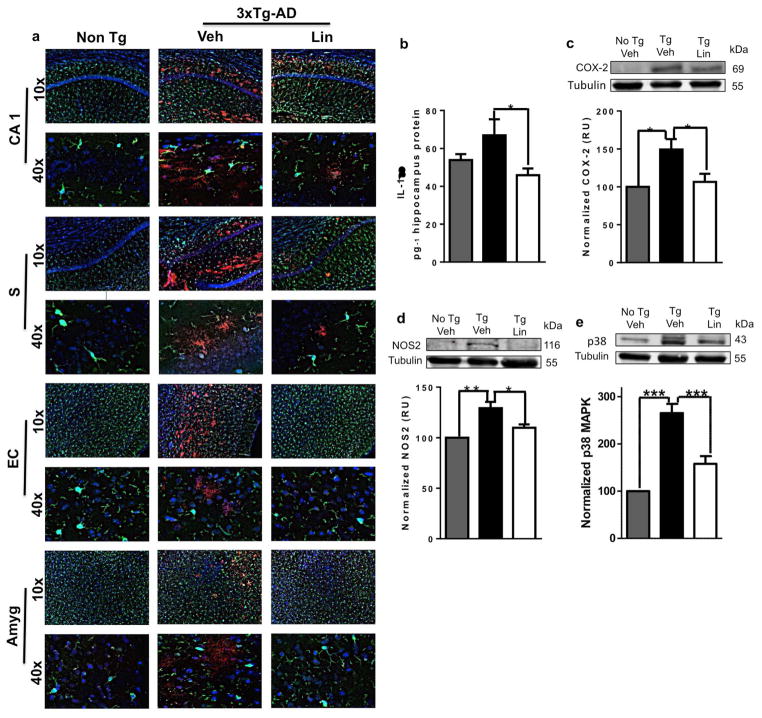
Figure 8. Linalool reduced the proinflammatory response in 3xTg-AD mice.
Morphological characterization showing nuclei stained with Hoechst (blue), β-amyloid stained with Alexa Fluor 594 phalloidin dye (red) and microglia visualized with Iba1 (green). Magnification, 10x and 60x. a) Representative images of CA1, subiculum, EC, and the amygdala. b) Quantification of IL-1β in hippocampal lysates. Representative bands and densitometric intensities of c) COX-2, d) NOS2 and e) p38 MAPK in hippocampal lysates. Veh: vehicle (Saline solution); Lin: Linalool; CA1 and S: subiculum of the hippocampus; EC: entorhinal cortex; Amyg: amygdala. The data are expressed as the means ± SEM. n=4–5. *p<0.05; **p<0.01‚ ***p<0.001.

