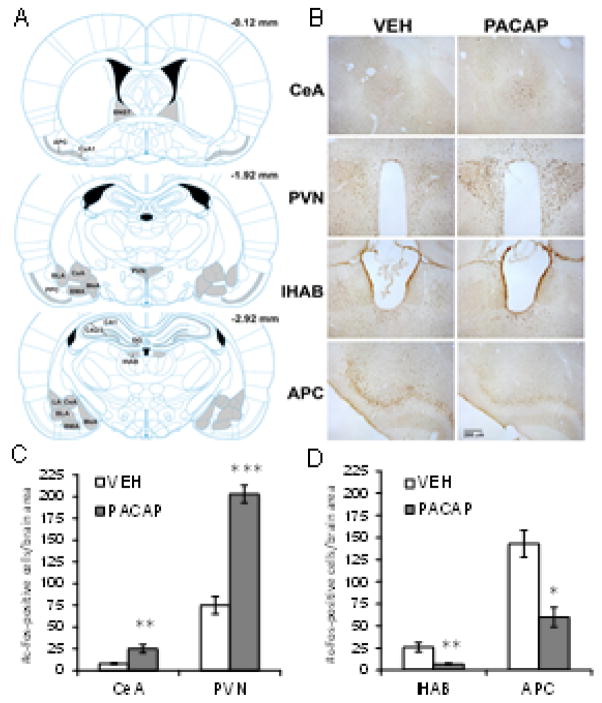
Figure 4. Effects of PACAP plus fear conditioning on c-Fos expression.
(A) Brain atlas plates from the atlas of Paxinos and Watson (2008) showing the brain areas examined (gray shaded) for c-Fos expression after treatment with VEH or PACAP (1.5 μg) followed by fear conditioning on Day 0. Brain section levels are indicated in millimeters posterior to bregma. (B) Representative coronal brain sections through areas showing a significant increase (e.g. central nucleus of the amygdala, CeA; paraventricular nucleus of the hypothalamus, PVN) or decrease (e.g. lateral habenula, lHAB; anterior piriform cortex, APC) in c-Fos expression after treatment with PACAP (1.5 ug) compared to VEH. Quantification of c-Fos expression in brain areas showing an increase (C) or decrease (D) in the number of c-Fos-positive cells after treatment with PACAP (1.5 μg) compared to VEH. VEH, n=5; PACAP, n=5. ***P<0.0005; **P<0.005; *P<0.05. Data are shown as mean±s.e.m.

