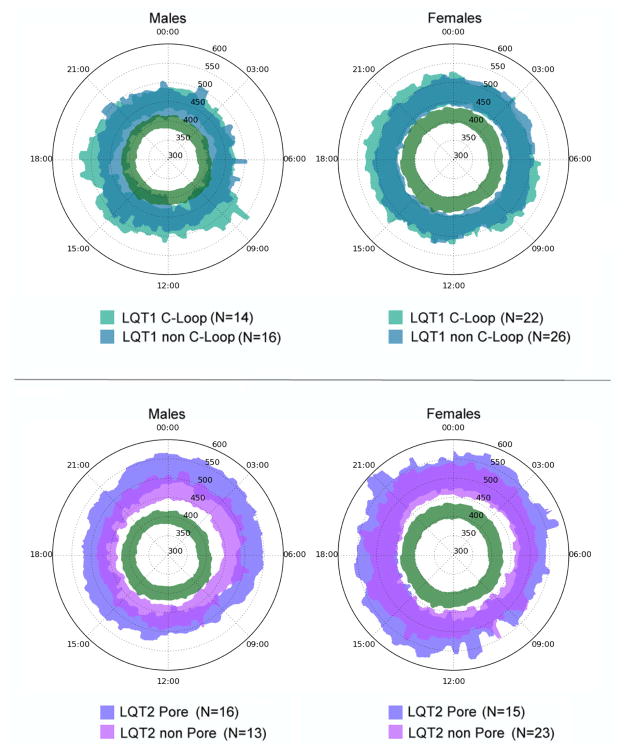
Figure 4.
Gender-specific QTcB clocks for LQT1 and LQT2 patients with missense mutations. The clocks show the 16th–84th percentile of QTc for LQT1 patients with mutations inside or outside the cytoplasmic loop (C-loop), and for LQT2 patients with mutations in pore and non-pore regions. The green area is the healthy region defined in Figure 2. The plots reveal the more pronounced QTc prolongation in males with missense mutations in the C-loop and pore regions for LQT1 and LQT2, respectively. In females, these differences are less pronounced.

