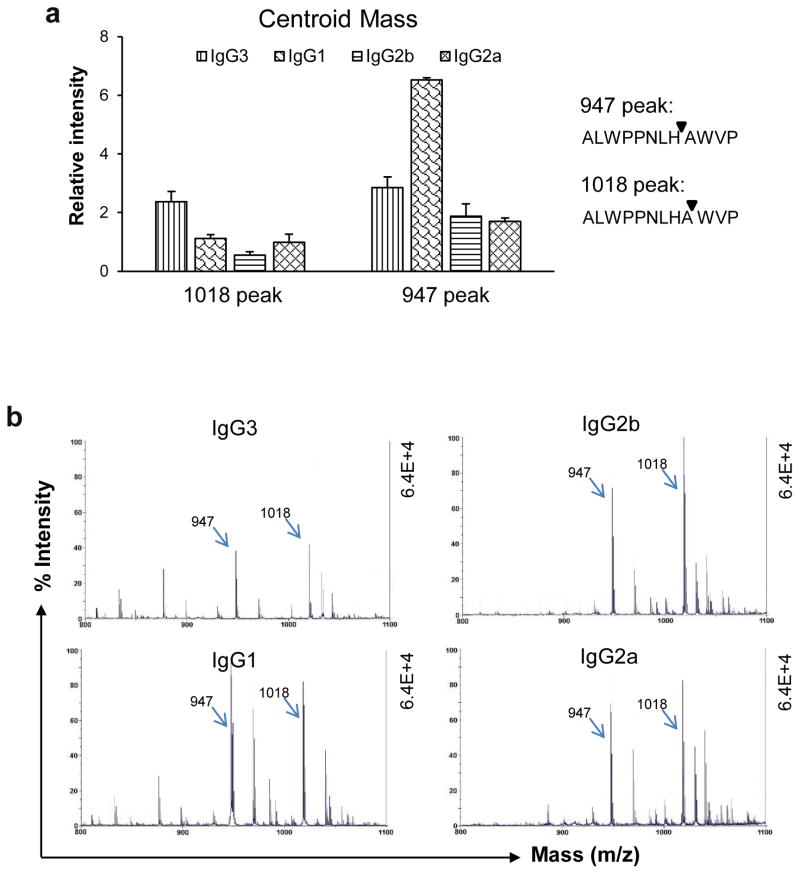
Fig 4.
The first-attack sites in ALW are shared by the PL9-11 panel isotypes. ALW and anti-DNA IgGs (molar ratio=2:1) were mixed at 37°C for 4 hours before MALDI-TOF mass spectrometry. (a) The relative intensities of the 947 peak (cleavage between 8th and 9th residues) and the 1018 peak (cleavage between 9th and 10th residues) were measured quantitatively, showing the highest 947 peak with PL9-11 IgG3, and the highest 1018 peak with IgG1 (p<0.05, compared to the other three isotypes accordingly). (b) Representative images (800 to 1010 m/z range) are shown, indicating the significance of the 947 and 1018 peaks. Data were from four independent experiments.

