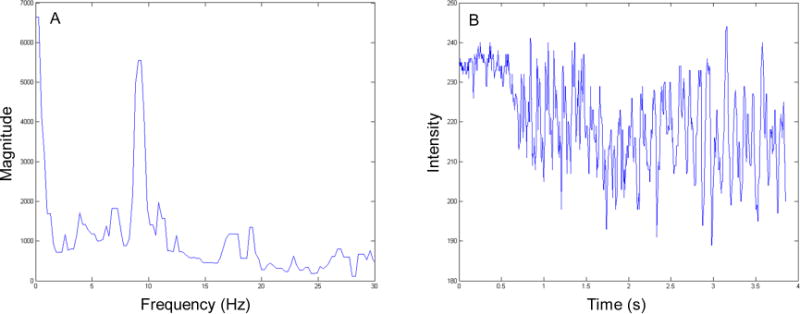
Figure 3. Phase-contrast microscopy FFT results.

(A) The corresponding frequency power spectrum from the selected points shown in Figure 2 showing a peak magnitude frequency of approximately 9 Hz. (B) The change in intensity in time domain plotted to assist the user in determining the characteristic frequency at the points of interest. The pixel intensity fluctuates with ciliary motion.
