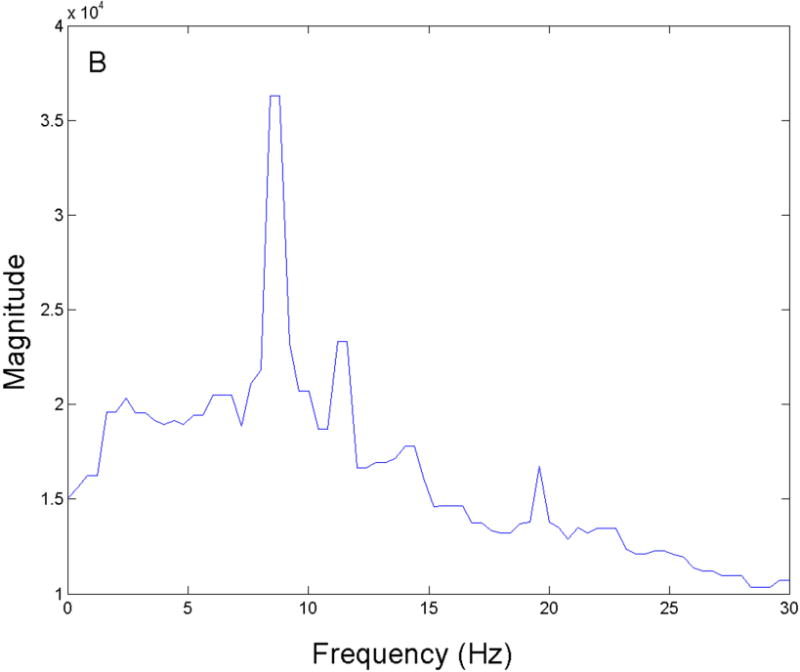
Figure 7. D-OCT FFT results.

An FFT was performed on the D-OCT signals and the resulting power spectra were summed across all A-lines to measure the highest magnitude frequency present at the surface of the ex vivo rabbit tracheal sample. A peak with the strongest magnitude was measured at approximately 9 Hz.
