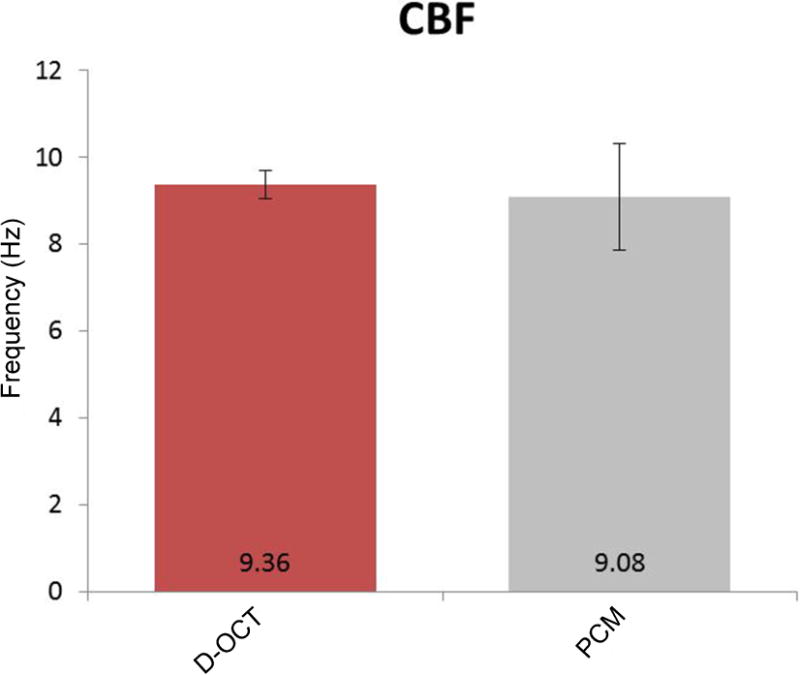
Figure 8. Comparison of CBF measurement by D-OCT and phase-contrast microscopy.

At physiologic temperature, CBF was measured at 9.36 ± 1.22 Hz using D-OCT and 9.08 ± 0.48 Hz using phase-contrast microscopy (n = 5). No significant differences were found between the two methods. Each error bar represents ±1 standard deviation. PCM = phase-contrast microscopy.
