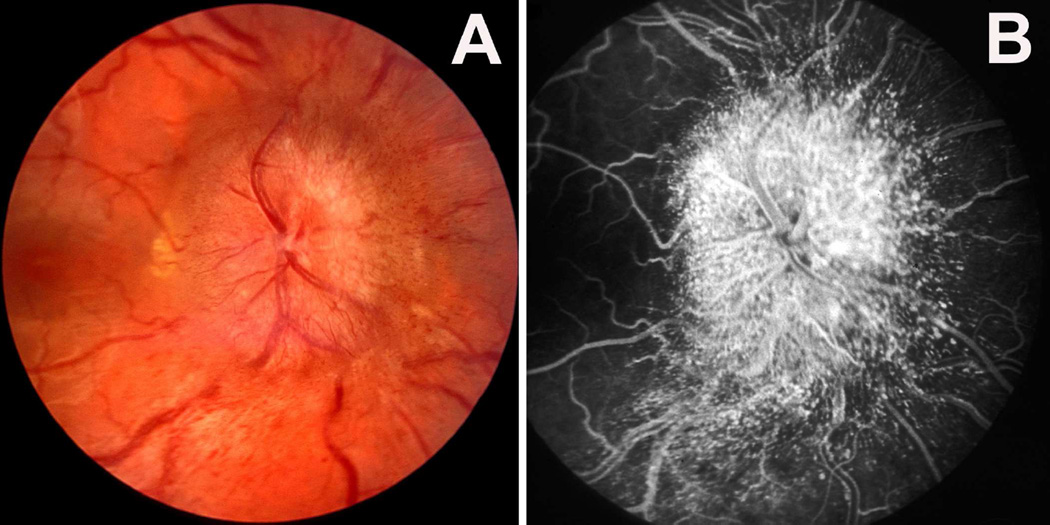
Fig. 47.
(A) shows more marked optic disc edema, markedly engorged retinal veins, and dilated capillaries on the optic disc and microaneurysms. (B) Fluorescein fundus angiogram during the arteriovenous phase shows dilated capillaries on the optic disc and in the region of the radial peripapillary and microaneurysms, and fluorescein leakage.

