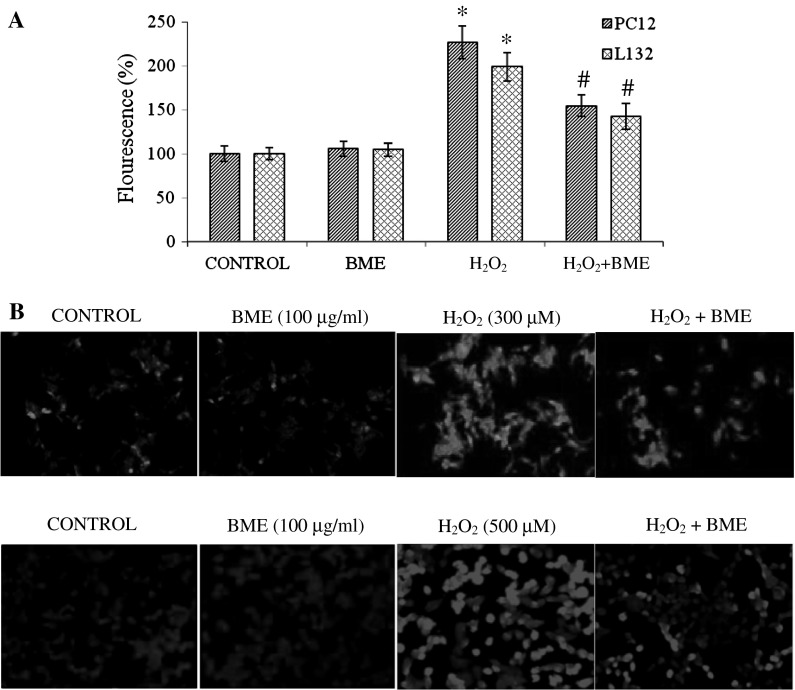
Fig. 4.
a Estimation of ROS production induced by H2O2 in PC12 and L132 cells. The data are represented as mean ± SEM of three independent experiments. *p < 0.05 versus the respective control group and # p < 0.05 versus the respective H2O2 treated group. b ROS production in PC12 and L132 cells was monitored by fluorescence microscopy. (from left to right) a Control cells without any treatment, b 100 μg/ml BME, c H2O2 (300 µM for PC12 and 500 µM for L132) for 24 h d cells pre-treatment with 100 μg/ml BME for 1 h and then exposed to H2O2 (300 µM for PC12 and 500 µM for L132) for 24 h

